G4-DMA Economic performance|G4-9
Net revenue
In 2016, consolidated net income was R$992.4 million, up by 24.8% in comparison to 2015, when it totaled R$795.1 million. This increase is the result of year-over-year growth of 8.8% in the customer base and of 9.5% in billed volume.
Net income by concession (%)
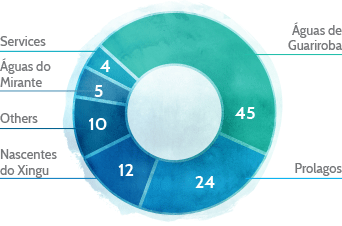 8. Amounts do not include construction revenue – CPC 17.
Costs and expenses
When discounting the effects of amortization and depreciations, costs and expenses for the year were 32.7% higher than in 2015.
Costs and expenses (thousands of R$)
| |
2016 |
2015 |
2014 |
| Personnel |
189,775 |
132,148 |
114,411 |
| Outside services |
79,594 |
54,373 |
50,760 |
| Conservation and maintenance |
13,219 |
8,976 |
7,041 |
| Materials, equipment and vehicles |
20,667 |
19,891 |
18,260 |
| Cost of concession |
8,200 |
5,309* |
5,626 |
| Electricity |
89,964 |
86,909 |
46,629 |
| Chemical products |
7,972 |
5,884 |
4,296 |
| Travel and room and board |
5,462 |
4,792 |
5,224 |
| Provision for doubtful debts |
49,153 |
29,481 |
6,405 |
| Provisions for contingency |
2,867 |
(5,133) |
157 |
| Research and development (R&D) of new business |
12,776 |
9,013 |
17,924 |
| Other costs |
38,013 |
29,603 |
27,842 |
| Subtotal |
529,944 |
392,522 |
304,576 |
| Amortization |
108,042 |
88,315 |
56,157 |
| Total |
637,986 |
480,837 |
360,733 |
* The amount reported in the last report considered cost with approval. The number was adjusted in this report in order to maintain the same basis of comparison.
Personnel costs and expenses grew by 43.6% compared to 2015 as a result of an 11.3% increase in total active staff9, especially at Águas de Meriti and at concessions gained in 2016.
Electricity, the Company’s second highest cash consumer, was 3.5% higher year-over-year. However, the variation is lower compared to the growth in this expense from 2014 to 2015 (86.4%). This is the result of investments in efficiency (see “Intellectual capital”) and rate readjustments allowed in 2015. Also during the year, readjustments were authorized at Prolagos (9.2%) and at Águas Guariroba (8.5%), as established in the concession contracts.
Aegea also developed a pilot program at Águas Guariroba to acquire energy on the free market. With this, the concessionaire estimates savings of up to R$9 million over the next five years. Energy acquired will power the pumping system that sends water from the Córrego Guariroba dam to the WTS, an operation that accounts for 46% of the unit’s power consumption. The Company intends to adopt the same practice at Prolagos next year.
9. The appropriate extraordinary management bonus in 2016 was R$43 million.
Default
The 180-day default rate fell by 1.2% year-over-year; this can be credited to the good performance of commercial actions promoted during the year (see “Population services”).
Operating income and Ebitda
Consolidated operating income in 2016 was R$354.4 million, up by 12.8% in comparison to 2015. Earnings before interest, taxes, depreciation and amortization (Ebitda) totaled R$462.5 million, growing by 14.9% compared to the year before.
Ebitda (R$ thousands)
| |
2016 |
2015 |
2014 |
| Operating income |
354,431 |
314,289 |
238,778 |
| (+) Depreciation and amortization |
108,042 |
88,315 |
56,157 |
| Ebitda |
462,473 |
402,604 |
294,935 |
| Ebitda Margin (%) |
46.6 |
50.6 |
49.2 |
Net earnings
Aegea’s net earnings in 2016 were R$103.1 million, 10.4% less than in 2015, mostly due to an increase in net financial expenses during the year.
Cash flow
Consolidated cash flow statement (R$ thousands)
| |
2016 |
2015 |
2014 |
| Cash flow of operational activities |
498,101 |
413,726 |
297,373 |
| Cash flow of operational activities (variation between assets, liabilities and others) |
117,432 |
107,778 |
122,698 |
| Cash flow of investment activities |
(383,237) |
(148,343) |
(387,790) |
| Cash flow from financing activities |
253,336 |
53,125 |
236,605 |
| Net increase (decrease) in cash and cash equivalents |
(12,469) |
12,560 |
(28,487) |
| Cash and cash equivalents – start of the period |
21,093 |
8,533 |
37,020 |
| Cash and cash equivalents – end of the period |
8,624 |
21,093 |
8,533 |
Indebtedness
Aegea ended the year with a balance of cash and cash equivalents of R$310.0 million. Gross debt, including hedging, was R$1.8 billion.
Indebtedness is explained by investments made in concessions, especially new concessions. This is a strategy that is based on the Indebtedness Policy and is aimed at accelerating the Company’s growth.
Indebtedness (R$ thousands)
| |
2016 |
Variation
2016/2015 (%) |
2015 |
2014 |
| Ebitda |
462,473 |
14.9 |
402,604 |
294,935 |
| Net debt |
1,480,146 |
26.4 |
1,170,578 |
815,756 |
| (+) Gross debt (including hedging) |
1,790,166 |
14.3 |
1,566,361 |
1,343,463 |
| (-) Cash |
(310,020) |
(21.7) |
(395,783) |
(557,707) |
| Net debt/Ebitda |
3.20 |
- |
2.91 |
2.77 |
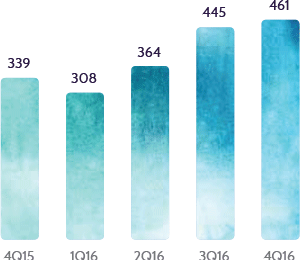
CAPEX (R$ millions)
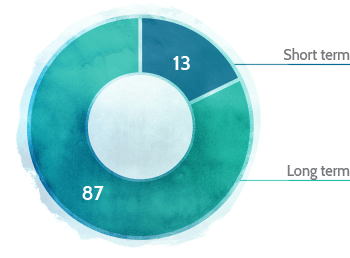
Debt distribution profile (%)
In 2016, the Company invested R$461 million, R$122 more than the year prior.
Debt amortization schedule
| |
R$ millions |
| Short term |
223.4 |
| 2018 |
349.8 |
| 2019 |
337.0 |
| 2020 |
87.7 |
| 2021 |
89.1 |
| 2022 onwards |
724.3 |
| |
1,811.3 |
| Funding cost (long term) |
(38.1) |
| Total |
1,773.2 |
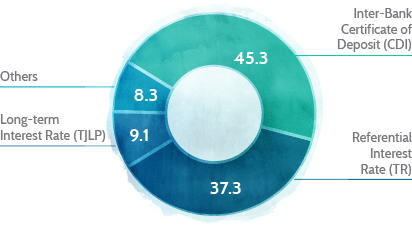
Gross debt by index (%)
Value Added Statement (VAS)
G4-EC1
R$763.6 million in value was added for the year, 17.2% more than in 2015. Of this amount, 13.5% was distributed to shareholders, with 3.3% as dividends and 10.2% as retained earnings; 21.5% went to employees; and 29.3% went to federal, state and municipal governments through taxes and contributions.
VAS (R$ thousands)
| |
2016 |
2015 |
2014 |
| Income |
1,516,841 |
1,157,360 |
1,037,543 |
| Inputs acquired from third parties |
(780,933) |
(547,974) |
(543,086) |
| Gross value added |
753,908 |
609,386 |
494,457 |
| Amortization |
108,042 |
(88,315) |
(56,157) |
| Net value added |
627,866 |
521,071 |
438,300 |
| Added value received in transfer |
135,783 |
130,768 |
70,716 |
| Total value added for distribution |
763,649 |
651,839 |
509,016 |
| Distribution of value added |
763,649 |
651,839 |
509,016 |
| Personnel |
164,280 |
115,836 |
118,010 |
| Taxes and contributions |
223,880 |
191,779 |
152,780 |
| Lenders and lessors |
272,360 |
229,068 |
125,988 |
| - Interest |
262,484 |
222,509 |
118,167 |
| - Rent |
8,876 |
6,559 |
7,821 |
| Remuneration of shareholders’ equity |
103,129 |
115,156 |
112,238 |
| - Dividends |
25,068 |
75,472 |
57,483 |
| - Retained earnings/losses for the period |
80,483 |
42,345 |
54,240 |
| - Non-controlling interest in retained earnings |
(2,422) |
(2,661) |
515 |