| CONSOLIDATED FINANCIAL INFORMATION (BRL MILLIONS) | 2013 | 2012 | 2011 | VARIATION 2013/2012 (%) |
| Net earnings | 192.2 | 82.5 | 92.1 | 133.1 |
| Amortization and depreciation | 97.3 | 82.9 | 53.6 | 17.3 |
| Net financial (expenditures) revenue | (62.1) | (82.5) | (84.4) | 24.8 |
| Income tax and social contribution | (4.6) | 20.0 | 29.1 | (111.4) |
| EBITDA1 | 222.9 | 122.9 | 90.5 | 81.3 |
| Oil and gas exploration expenditures with sub-commercial and dry wells2 | 48.5 | 162.1 | 13.2 | (70.1) |
| EBITDAX3 | 271.4 | 285.1 | 103.6 | (4.8) |
| EBITDA4 margin (%) | 45.9 | 26.6 | 31.3 | 72.5 |
| EBITDAX5 margin | 55.8 | 61.7 | 35.9 | (9.4) |
| Net debt6 | (837.8) | (952.3) | (1.098.50) | 12.0 |
| Net debt/EBITDAX | (3.1) | (3.3) | (10.6) | 7.6 |
1. Calculation of the EBITDA considers the net earnings before income tax and social contribution, net financial results and expenses without amortization. EBITDA is not a financial measure according to accounting practices adopted in Brazil and the International Financial Reporting Standards (IFRS). It should not be considered in isolation or as an alternative to net earnings, as a measure of operational performance or as an alternative to operating cash flow, as a measure of liquidity. Other companies may calculate EBITDA differently than QGEP. In addition EBITDA has limitations that hinder its use as a measure of the Company’s profitability, since it does not consider certain costs inherent to the business which could significantly affect net results, such as net financial revenue, taxes and amortization. QGEP uses the EBITDA as an additional measure of its operating performance.
2. Exploration expenditures related to sub-commercial wells or wells with non-commercial volumes.
3. EBITDAX is a measure used in the oil and gas industry that is calculated as follows: EBITDA + expenditures on exploration of dry or sub-commercial wells.
4. EBITDA divided by net revenue.
5. EBITDAX divided by net revenue.
6. Net debt corresponds to total debt, including current and long term loans and financing and derivative financial instruments, minus cash, cash equivalents and securities. Net debt is not recognized according to accounting practices used in Brazil, by the IFRS or by US GAAP, or by any other generally accepted accounting principles. Other companies may calculate net debt differently.
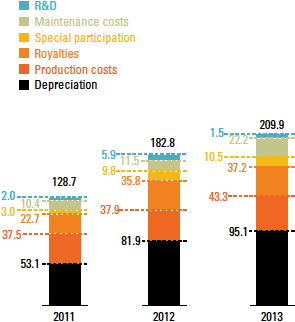
Manati was the largest gas producing field in Brazil in 2013, accounting for 32% of gas produced in the Northeast Region and 8% of total gas production in Brazil. Average daily gas production in the year was 6.0 million m3, compared to 6.1 million m3 per day in 2012 and 4.1 million m3 per day in 2011. With this, QGEP achieved net revenue of BRL486.1 million in 2013, an amount 5% higher than in 2012. In turn, operating costs saw an increase of 14.8% in the same period, as a result of scheduled maintenance that took place at the Manati Field.
OPERATING COSTS (BRL MILLIONS)

General and administrative costs totaled BRL68.6 million, which is 8.4% higher than in 2012. Part of the administrative expenses are transferred to the partners as QGEP is the operator of Block BS-4 and holds 30% of this amount. The remainder 70% is related to the partners of the block that reimburse expenses to the operator. Total amount transferred in 2013 was R$23.0 million compared to R$12.8 million in 2012. Full Year 2013 exploration expenses totaled R$81.5 million, in relation to the return of Block BM-S-12 to the ANP and to the drilling of the extension well in the Carcará discovery. In 2012, these expenditures totaled BRL177.0 million, when expenses were impacted by the write-off of the Ilha do Macuco well and the relinquishment of the Jequitibá discovery.
The Company has a fiscal incentive which reduces income tax relating to the Manati Field by 75%. An amount equal amount to the amount gained from fiscal savings should be appropriated in an earnings reserve account, in shareholder equity, and may not be distributed as dividends to shareholders. Moreover, QGEP uses the fiscal benefits established in the Good Act (Lei do Bem), the Rouanet Act (Lei Rouanet), the Sports Incentive Act (Lei de Incentivo ao Esporte), and the Worker Meal Program (Programa de Alimentação ao Trabalhador). In 2013, fiscal incentives totaled BRL43.8 million, compared to BRL47.0 million in 2012. GRI G4-EC4
The net financial result was BRL62.1 million, 24.8% less than in 2012, when the company had financial revenue of BRL22.8 million related to the exchange rate variation on the balance payable of 30% of the share in Block BS-4.
QGEP results reinforce the positive balance of 2013: operating cash flow generation was up by 48.0%, reaching BRL376.4 million. Net earnings grew by 133.1% compared to the previous year, going from BRL82.5 million to BRL192.2 million.
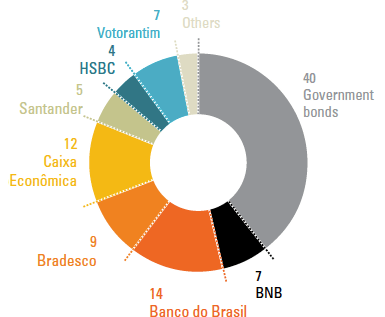
At the end of 2013, 17% of QGEP’s financial investments were invested in exchange rate funds, while the rest remained in Brazilian currency. The average accumulated yield on cash in BRL for the period was 102.3% of the CDI, with approximately 99% of the funds investing having daily liquidity. Investments in BRL were distributed as shown in the graph, with 99% of them classified with a AAA rating and 1% of the total rated AA (except for government bonds).
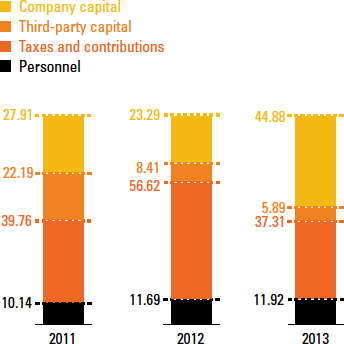
| DISTRIBUTION OF INVESTMENTS IN 2013 (%) | VALUE-ADDED DISTRIBUTION (%) | |
 |
 |
Total indebtedness at the end of the year was BRL167.9 million, with BRL0.6 million related to interest (BRL0.4 million of which was amortized) and BRL1.7 million related to banking fees. This indebtedness is related to the portion of funding obtained from the Funding Authority for Studies and Projects (Finep) to provide support to development of the Anticipated Production System (Sistema de Produção Antecipada – SPA) in the Atlanta Field, in the total amount of BRL266.1 million. This financing is comprised of two lines of credit, one at a fixed rate and one at a floating rate, both of which currently have an annual interest rate equal to 3.5%, with a grace period of three years and a repay period of seven years.
In relation to the Value-Added Statement (VAS), changes in 2013 resulted mostly from expansion of the staff and increased sale prices for gas and condensate.
GRI G4-EC1| VALUE-ADDED STATEMENT (VAS – BRL THOUSANDS) | 2013 | 2012 | 2011 |
|---|---|---|---|
| Revenues | 994,197 | 691,534 | 898,777 |
| Sales of gas | 612,804 | 586,053 | 370,020 |
| Other revenues | 581 | 779 | 383 |
| Revenues related to construction of proprietary assets | 380,812 | 104,702 | 221,084 |
| Acquisition of exploration concession | - | - | 305,290 |
| Supplies acquired from third parties (includes taxes) | 544,120 | 365,257 | 669,472 |
| Cost of products, goods and services sold | 147,331 | 228,475 | 100,991 |
| Materials, energy, third-party services, and others | 379,661 | 120,597 | 561,300 |
| Others | 17,128 | 16,186 | 7,181 |
| Gross value-added | 450,077 | 326,277 | 229,305 |
| Depreciation, depletion and amortization | 97,286 | 82,919 | 53,606 |
| Net added value produced (used) by the organization | 352,791 | 243,358 | 175,699 |
| Added value received in transfer | 84,146 | 110,721 | 153,276 |
| Result of equity accounting and dividends | (440) | - | - |
| Financial revenues | 84,586 | 84,135 | 153,276 |
| Others | - | 26,586 | - |
| Total added value to distribute | 436,937 | 354,079 | 328,975 |
| Added value distributed | 436,937 | 354,079 | 328,975 |
| Personnel | 57,462 | 41,377 | 33,478 |
| Direct remuneration | 51,820 | 39,253 | 32,668 |
| Benefits | 3,792 | 1,258 | 540 |
| Government Severance Indemnity Fund for Employees – FGTS | 1,850 | 866 | 270 |
| Taxes and contributions | 161,324 | 200,467 | 131,290 |
| Federal taxes | 57,934 | 99,654 | 64,441 |
| State taxes | 54,539 | 55,134 | 42,109 |
| Municipal taxes | 83 | 30 | 29 |
| ANP (bonus + royalties) | 48,768 | 45,649 | 24,711 |
| Remuneration of third party capital | 25,909 | 29,767 | 72,070 |
| Interest | 364 | 3,356 | 20,421 |
| Rent | 3,224 | 1,074 | 578 |
| Bank expenses | 1,431 | 447 | 2,570 |
| Exchange/monetary variation | 20,890 | 24,890 | 48,501 |
| Remuneration of shareholders’ equity | 192,242 | 82,468 | 92,137 |
| Net income for the period | 192,242 | 82,468 | 92,137 |