GRI EC1; EC4
Net Operating Revenues

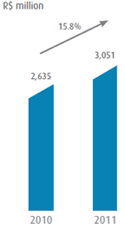
In 2011, Algar Group’s consolidated net revenues amounted to R$3.1 billion, representing a 15.8% growth over 2010 revenues of
R$2.6 billion. Growth in operating revenues was experienced by all the business segments in which the Company operates, particularly in the Agribusiness segment, deriving from the rise in both soybean prices and sakes volumes. The second best performance was seen in the IT/Telecom segment, driven by the voice and data transmission services to the corporate market within its concession area, as well as the outsourcing of business and technological processes.

In 2011, the operating costs registered by the Algar Group amounted to R$2.1 billion, representing a 16.6% increase over the R$1.8 billion in 2010. The costs of acquisition of raw material and inputs showed the highest rise, of 35.9%, from R$648.8 million in 2010 to R$881.8 million in 2011. This amount accounts for 41.1% of overall costs in the year, or 4.3 percentage points (p.p.) above the percentage that represented over total operating costs in 2010. Other items that showed significant rises were: connection costs – EILD, by 34.3%, to R$39.7 million; and costs with personnel and third-party services, by 25.2% and 25.0%, totaling R$489.6 million and R$206.8 million respectively.
The increase in raw material costs can be explained by the intrinsic nature of the operations carried out by its subsidiary Algar Agro. In 2011, these costs accounted for 91.6% of overall CGS. This item alone increased by 35.9% during the period, deriving from the larger volume of soybeans originated during the year, coupled with the market price oscillations. In turn, costs related to connection – EILD concern the expenses on the use of third-party grids, in order to serve the corporate clients within the Company’s concession area.
Gross Profit and Gross Margin
After deduction of the operating costs described above, the Algar Group recorded gross profit of R$905.7 million in 2011, 4.0% higher than the amount registered in the previous year, of R$871.0 million. At the close of 2011, gross margin stood at 29.7%, 3.4 p.p. below the 33.1% margin posted in 2010, as a result of higher costs.
Total operating expenses in 2011 came to R$543.1 million, 12.9% higher than the R$481.2 million expenses registered in 2010. This increase primarily stemmed from the 14.1% rise in selling expenses, which moved up from R$302.8 million in 2010 to R$345.6 million in 2011. This was due to the growth in the Company’s businesses, particularly in the sales volume of agricultural products, which caused freight expenses to rise.
G&A expenses grew by 10.7% year-over-year, to R$197.5 million in 2011. The rise in G&A expenses was due to increases in expenses on materials and personnel, by 38.8% and 13.4% year-over-year respectively. This rise is directly connected to the expansion of its businesses in the Agribusiness and Telecom segments, both in terms of more hires of associates and in terms of the operational structure.
EBITDA and EBITDA Margin

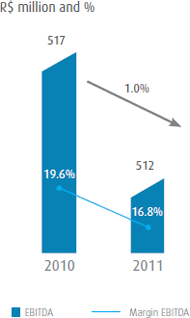
In 2011, the operating cash generation measured by the EBITDA (earnings before interest, taxes, depreciation and amortization) amounted to R$512 million, representing a slight drop of 1.0% over the R$517 million registered in 2010. The EBITDA margin dropped by 2.8 p.p. in the same basis of comparison, and stood at 16.8% at the close of 2011. The drop in the Company’s EBITDA margin is related to the rise in operating costs, in spite of the growth in revenues during the period. For the calculation of the EBITDA, the adjusting effects from the operations in the Agribusiness segment were taken into account (booked as financial expenses, although they relate to the operations).
Source: Company.
Net Income
The Algar Group’s consolidated net income in 2011 totaled R$200.3 million, representing an 8.4% growth over the R$184.8 million net income in 2010. The margin over the net operating revenues stood at 6.6%, representing a 0.5 percentage point decrease year-over-year, however above the margin recorded in previous years.
Debt
As at December 31, 2011, the Company’s consolidated gross debt amounted to R$1.7 billion, with a cash position of R$546.7 million, thus resulting in a net debt of R$1.1 billion on the same date. At the end of 2010, net debt totaled R$945.3 million, thus indicating that there was a 24.7% year-over-year increase in 2011 net debt.

In 2011, the short-term debt totaled R$827.5 million, up 32.9% over 2010 (R$622.6 million). As for the long-term debt, there was a 27.9% increase year-over-year, moving up from R$702.5 million in 2010 to R$898.3 million in 2011. The short-term debt ratio in 2010 versus 2011 rose 0.9 p.p., whereas the change in the long-term ratio fell in the same proportion.
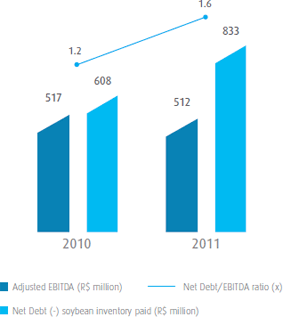
At the end of 2011, the Algar Group’s consolidated net debt, considering cash and cash equivalents, as well as the inventory of soybeans (already paid for), amounted to R$833 million, R$225 million above the 2010 figure, mainly due to the increased financing required to fund part of the investments carried out during the year, which totaled R$489 million.
The net debt/EBITDA ratio was 1.6 times in 2011, versus 1.2 times in 2010.
Debt Coverage

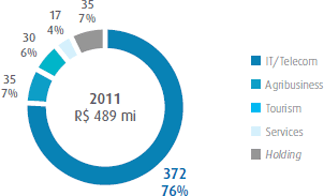
In 2011, Algar Group invested R$489 million throughout its entire business network, up 70% from the overall investments of R$288 million made in 2010.
Investments were mainly directed to the IT/Telecom segment, totaling R$372 million. From that amount, 39% was earmarked for voice and data transmission products; 12% to the Minas Project – expansion in retail services to new regions through the acquisition of Band H sold at an auction; 11% to the CTBC i.você Program – which entails the migration of all the Company’s grids to the NGN grids (Next Generation Network); 7% to the Business Process and Technology Outsourcing services; 5% to the pay TV; 17% to the maintenance of the clients base, and the remaining 9% distributed throughout the other services and segments.
In the Agribusiness segment, investments were mainly allocated in the construction of the new refinery in Porto Franco plant in State of Maranhão.
In the Tourism segment, investments were mainly allocated to the construction of the first premium hotel in Brazil, oriented to the Vacation Ownership segment, which was inaugurated in December 2011; in addition to investments in property maintenance and new attractions at the park.

In 2011, the Algar Group generated a net value added of R$2.0 billion, versus R$1.7 billion in 2010, representing 56% of gross revenues, and showed the following breakdown among the various stakeholders:

The Algar Group uses fiscal incentives from the three spheres of public administration: municipal (ISS and IPTU – Culture Incentive Law of Uberlândia), state (State Law of Incentive to Culture) and federal (Fund for Children and Adolescents (FIA), Rouanet Law – Culture Incentive Law).
- Aladim e a Lâmpada Maravilhosa: R$40,000.00
- Mostra de Teatro Infantojuvenil de Uberlândia: R$30,000.00
2. State of Minas Gerais Law of Incentive to Culture (ICMS-MG)
7th Festival de Cordas Nathan Schwartzman: R$137,500.00
Concurso de Bandas Triângulo Music: R$443,750.00
Do Fio ao Sem Fio: R$359,712.00
Expedição Rio Uberabinha: R$151,862.15
Olho Portátil: R$324,546.25
Orquestra Jovem de Uberlândia: R$135,000.00
Parangolé com Crianças: R$140,453.75
Rasgacêro e os Artêros Geraes: R$108,750.00
Triângulo das Geraes: R$291,000.00
Uberlândia de Ontem e Sempre: R$250,000.00
Se Tocar eu Danço: R$75,000.00
3. Federal Law of Incentive to Culture (Rouanet Law)
Parangolé com Crianças – Ano II: R$245,752.80
Ideias Incontidas – Ano II: R$254,247.20
Construção do Teatro Municipal de Uberlândia: R$100,000.00
Um Violino Com Amor: R$33,850.00
Circulação Nicolau: R$93,550.00
Rondon Pacheco: R$63,870.00
Natal no Campus 2011: R$10,000.00
4. Federal Law of Incentive to Sports (Sports Law)
Piloto do Futuro: R$207,848.00
5. Fund for Children and Teenagers
Fundação Benjamin Guimarães – Hospital da Baleia: R$5,050.00
Hospital GRAAC: R$ 7,265.00
Hospital Pequeno Príncipe – CEDCA: R$7,610.00
Conselho Municipal do Direito da Criança e do Adolescente: R$12,200.00
Conselho Tutelar de Araxá: R$16,370.00
Prefeitura de Uberaba: R$15,600.00
Lar de Amparo Menor Viva a Vida: R$40,000.00
Conselho Municipal do Direito da Criança e do Adolescente: R$4,000.00
ONG Missão Criança: R$15,600.00
AACD: R$10,000.00
Conselho Municipal dos Direitos da Criança e do Adolescente: R$12,200.00
AACD Porto Alegre: R$15,600.00
Conselho Municipal de Franca: R$12,400.00
Conselho Municipal de Itumbiara: R$7,500.00
Araguari: R$10,088.00
Cláudio: R$4,049.00
Also in 2011, the Algar Group received R$1,064,103.00 from fiscal incentives to technological innovation, directed to R&D projects of Algar Telecom and Algar Tecnologia. In 2010 and 2009, the respective amounts were R$777,408,000 and R$834,340,000.
top
Net Operating Revenues

In 2011, Algar Group’s consolidated net revenues amounted to R$3.1 billion, representing a 15.8% growth over 2010 revenues of
R$2.6 billion. Growth in operating revenues was experienced by all the business segments in which the Company operates, particularly in the Agribusiness segment, deriving from the rise in both soybean prices and sakes volumes. The second best performance was seen in the IT/Telecom segment, driven by the voice and data transmission services to the corporate market within its concession area, as well as the outsourcing of business and technological processes.
Breakdown of Consolidated Net Revenues
Cost of Goods Sold and Services Provided

In 2011, the operating costs registered by the Algar Group amounted to R$2.1 billion, representing a 16.6% increase over the R$1.8 billion in 2010. The costs of acquisition of raw material and inputs showed the highest rise, of 35.9%, from R$648.8 million in 2010 to R$881.8 million in 2011. This amount accounts for 41.1% of overall costs in the year, or 4.3 percentage points (p.p.) above the percentage that represented over total operating costs in 2010. Other items that showed significant rises were: connection costs – EILD, by 34.3%, to R$39.7 million; and costs with personnel and third-party services, by 25.2% and 25.0%, totaling R$489.6 million and R$206.8 million respectively.
The increase in raw material costs can be explained by the intrinsic nature of the operations carried out by its subsidiary Algar Agro. In 2011, these costs accounted for 91.6% of overall CGS. This item alone increased by 35.9% during the period, deriving from the larger volume of soybeans originated during the year, coupled with the market price oscillations. In turn, costs related to connection – EILD concern the expenses on the use of third-party grids, in order to serve the corporate clients within the Company’s concession area.
Gross Profit and Gross Margin
After deduction of the operating costs described above, the Algar Group recorded gross profit of R$905.7 million in 2011, 4.0% higher than the amount registered in the previous year, of R$871.0 million. At the close of 2011, gross margin stood at 29.7%, 3.4 p.p. below the 33.1% margin posted in 2010, as a result of higher costs.Operating Expenses
| 2011 | 2010 | 2011 x 2010 | |
|---|---|---|---|
| Selling Expenses | 345,584 | 302,782 | 14.1% |
| General & Administrative (G&A) Expenses | 197,571 | 178,474 | 10.7% |
| Total Operating Expenses | 543,155 | 481,256 | 12.9% |
Total operating expenses in 2011 came to R$543.1 million, 12.9% higher than the R$481.2 million expenses registered in 2010. This increase primarily stemmed from the 14.1% rise in selling expenses, which moved up from R$302.8 million in 2010 to R$345.6 million in 2011. This was due to the growth in the Company’s businesses, particularly in the sales volume of agricultural products, which caused freight expenses to rise.
G&A expenses grew by 10.7% year-over-year, to R$197.5 million in 2011. The rise in G&A expenses was due to increases in expenses on materials and personnel, by 38.8% and 13.4% year-over-year respectively. This rise is directly connected to the expansion of its businesses in the Agribusiness and Telecom segments, both in terms of more hires of associates and in terms of the operational structure.
EBITDA and EBITDA Margin

In 2011, the operating cash generation measured by the EBITDA (earnings before interest, taxes, depreciation and amortization) amounted to R$512 million, representing a slight drop of 1.0% over the R$517 million registered in 2010. The EBITDA margin dropped by 2.8 p.p. in the same basis of comparison, and stood at 16.8% at the close of 2011. The drop in the Company’s EBITDA margin is related to the rise in operating costs, in spite of the growth in revenues during the period. For the calculation of the EBITDA, the adjusting effects from the operations in the Agribusiness segment were taken into account (booked as financial expenses, although they relate to the operations).
| R$ million | ||
|---|---|---|
| Adjusted EBITDA – Agribusiness Segment | 2010 | 2011 |
| Result from Hedging Financial Instruments | (32) | 70 |
| Result from Foreign Exchange Variation | (3) | (56) |
| Net Financial Result from Working Capital Operations | (12) | (37) |
| (46) | (22) | |
| 2011 | 2010 | 2011 x 2010 | |
|---|---|---|---|
| Financial Income | 358,647 | 258,163 | 38.9% |
| Financial Expenses | (488,181) | (389,737) | 25.3% |
| Net Financial Income (Expense) | (129,534) | (131,574) | (1.6%) |
Financial activities resulted in net financial expenses of R$129.5 million, 1.6% below the R$131.6 million registered in 2010.
Considering the adjusting effects from the operations in the Agribusiness segment (booked as financial expenses, although they relate to the operations), net financial expenses came to R$107 million in 2011 versus R$85 million in 2010. The 26% rise was primarily due to the increase in debt, required to fund the investments made in 2011, as well as to the increase in the SELIC (basic interest rate), when compared with 2010 (40% of the financing contracts are pegged to CDI).
Net Income
The Algar Group’s consolidated net income in 2011 totaled R$200.3 million, representing an 8.4% growth over the R$184.8 million net income in 2010. The margin over the net operating revenues stood at 6.6%, representing a 0.5 percentage point decrease year-over-year, however above the margin recorded in previous years.Debt
As at December 31, 2011, the Company’s consolidated gross debt amounted to R$1.7 billion, with a cash position of R$546.7 million, thus resulting in a net debt of R$1.1 billion on the same date. At the end of 2010, net debt totaled R$945.3 million, thus indicating that there was a 24.7% year-over-year increase in 2011 net debt.
In 2011, the short-term debt totaled R$827.5 million, up 32.9% over 2010 (R$622.6 million). As for the long-term debt, there was a 27.9% increase year-over-year, moving up from R$702.5 million in 2010 to R$898.3 million in 2011. The short-term debt ratio in 2010 versus 2011 rose 0.9 p.p., whereas the change in the long-term ratio fell in the same proportion.
At the end of 2011, the Algar Group’s consolidated net debt, considering cash and cash equivalents, as well as the inventory of soybeans (already paid for), amounted to R$833 million, R$225 million above the 2010 figure, mainly due to the increased financing required to fund part of the investments carried out during the year, which totaled R$489 million.
The net debt/EBITDA ratio was 1.6 times in 2011, versus 1.2 times in 2010.
Debt Coverage

Investments (CAPEX)
In 2011, Algar Group invested R$489 million throughout its entire business network, up 70% from the overall investments of R$288 million made in 2010.
Investments were mainly directed to the IT/Telecom segment, totaling R$372 million. From that amount, 39% was earmarked for voice and data transmission products; 12% to the Minas Project – expansion in retail services to new regions through the acquisition of Band H sold at an auction; 11% to the CTBC i.você Program – which entails the migration of all the Company’s grids to the NGN grids (Next Generation Network); 7% to the Business Process and Technology Outsourcing services; 5% to the pay TV; 17% to the maintenance of the clients base, and the remaining 9% distributed throughout the other services and segments.
In the Agribusiness segment, investments were mainly allocated in the construction of the new refinery in Porto Franco plant in State of Maranhão.
In the Tourism segment, investments were mainly allocated to the construction of the first premium hotel in Brazil, oriented to the Vacation Ownership segment, which was inaugurated in December 2011; in addition to investments in property maintenance and new attractions at the park.
CAPEX Breakdown (R$ million)

Value Added
In 2011, the Algar Group generated a net value added of R$2.0 billion, versus R$1.7 billion in 2010, representing 56% of gross revenues, and showed the following breakdown among the various stakeholders:
Significant Financial Assistance Received from the Government
The Algar Group uses fiscal incentives from the three spheres of public administration: municipal (ISS and IPTU – Culture Incentive Law of Uberlândia), state (State Law of Incentive to Culture) and federal (Fund for Children and Adolescents (FIA), Rouanet Law – Culture Incentive Law).| Amounts in R$ | |||
|---|---|---|---|
| Fiscal Incentive | 2011 | 2010 | 2009 |
| Municipal Law of Incentive to Culture (ISS/IPTU) – Uberlândia | 70,000 | 151,000 | 215,000 |
| State of Minas Gerais Law of Incentive to Culture (ICMS-MG) | 2,417,574 | 2,219,542 | 1,076,300 |
| Federal Law of Incentive to Culture (Rouanet Law) | 801,270 | 804,330 | 392,620 |
| Federal Law of Incentive to Sports (Sports Law) | 207,848 | 201,167 | 128,080 |
| Fund for Children and Teenagers | 207,732 | 202,834 | 49,423 |
In 2011, fiscal incentives used amounted to R$3,704,424.00, which was allocated to the following projects/institutions:
1. Municipal Law of Incentive to Culture – Uberlândia- Aladim e a Lâmpada Maravilhosa: R$40,000.00
- Mostra de Teatro Infantojuvenil de Uberlândia: R$30,000.00
2. State of Minas Gerais Law of Incentive to Culture (ICMS-MG)
7th Festival de Cordas Nathan Schwartzman: R$137,500.00
Concurso de Bandas Triângulo Music: R$443,750.00
Do Fio ao Sem Fio: R$359,712.00
Expedição Rio Uberabinha: R$151,862.15
Olho Portátil: R$324,546.25
Orquestra Jovem de Uberlândia: R$135,000.00
Parangolé com Crianças: R$140,453.75
Rasgacêro e os Artêros Geraes: R$108,750.00
Triângulo das Geraes: R$291,000.00
Uberlândia de Ontem e Sempre: R$250,000.00
Se Tocar eu Danço: R$75,000.00
3. Federal Law of Incentive to Culture (Rouanet Law)
Parangolé com Crianças – Ano II: R$245,752.80
Ideias Incontidas – Ano II: R$254,247.20
Construção do Teatro Municipal de Uberlândia: R$100,000.00
Um Violino Com Amor: R$33,850.00
Circulação Nicolau: R$93,550.00
Rondon Pacheco: R$63,870.00
Natal no Campus 2011: R$10,000.00
4. Federal Law of Incentive to Sports (Sports Law)
Piloto do Futuro: R$207,848.00
5. Fund for Children and Teenagers
Fundação Benjamin Guimarães – Hospital da Baleia: R$5,050.00
Hospital GRAAC: R$ 7,265.00
Hospital Pequeno Príncipe – CEDCA: R$7,610.00
Conselho Municipal do Direito da Criança e do Adolescente: R$12,200.00
Conselho Tutelar de Araxá: R$16,370.00
Prefeitura de Uberaba: R$15,600.00
Lar de Amparo Menor Viva a Vida: R$40,000.00
Conselho Municipal do Direito da Criança e do Adolescente: R$4,000.00
ONG Missão Criança: R$15,600.00
AACD: R$10,000.00
Conselho Municipal dos Direitos da Criança e do Adolescente: R$12,200.00
AACD Porto Alegre: R$15,600.00
Conselho Municipal de Franca: R$12,400.00
Conselho Municipal de Itumbiara: R$7,500.00
Araguari: R$10,088.00
Cláudio: R$4,049.00
Also in 2011, the Algar Group received R$1,064,103.00 from fiscal incentives to technological innovation, directed to R&D projects of Algar Telecom and Algar Tecnologia. In 2010 and 2009, the respective amounts were R$777,408,000 and R$834,340,000.
top
