Sustainability Report
Sales – 2011
R$ 1,21.,8 milion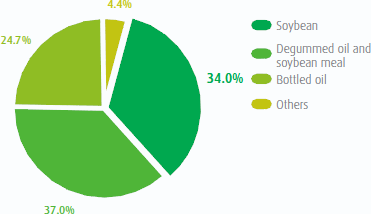
Net sales x Volume
* 2077 and 2008 results not according to IRFS
** 2007 non-consolidated result: only ABC Inco
CGS – 2011
R$ 963.0 milion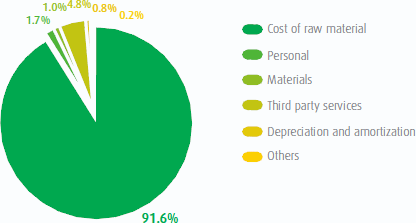
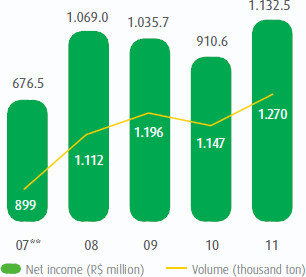
The good performance of operations in 2011 are evident in Algar Agro’s consolitated results. With 1.3 million tons of originated soybeans, the company broke its previous record in terms of volume. The economic uncertainty caused by the Eurozone fiscal crisis, in world terms, and the cooling of the Brazilian economy, in domestic terms, did not have a negative impact on the main market of the Company, that is, the soybean and derivatives market.
Price oscillations, typical of commodities, were dealt with by protection strategies based on hedging operations. The Maranhão unit continued to increase its share in the results, with its expansion in capacity of soybean meal and degummed oil production, while the Triângulo Mineiro unit maintained its high productivity and regional leadership in the bottled oil market, as well as increasing sales in the ABC de Minas brand. Exports of soybean and soybean meal also increased.
2011 net operating revenue increased by 24.4% year-on-year , reaching R$ 1132.5 million. This was accounted for by increases in all sales lines: soybeans, degummed oil and soybean meal, bottled oil, cattle, pigs, milk and the ABC de Minas range.
During the same period, the cost of good sold (CGS) increased by 33.4% from R$ 722.0 million in 2010 to R$ 963.0 million in 2011. CGS is accounted for by the cost of raw materials, which amounted to 91.6% of total CGS. This item increased by 35.9% in the period, due to higher volume of soybean bought, as well as price variation.
With GCS increasing more than net revenue, gross profit fell by 10.1% in the year, reaching R$ 169.5 million, representing a gross margin of 15.0%.
The growth in business was reflected in higher operational expenses, which increased by 19.3% in 2011, from R$ 87.1 million to R$ 103.9 million . Due to the nature of Algar Agro’s activities, focussed on the marketing of agricultural products, sales expenses accounted for the majority of operational costs. In 2011 this item reached R$ 75.0 million (an increase of 23.2% in the period), accounting for 72.2% of total operational costs. Commercial expenses tend to follow the volume of sales and are represented by transportation costs, fobbings (export costs) and sales commissions.
Operational Expenses
| 2010 R$ 87.1 million |
2011 R$ 103.9 million |
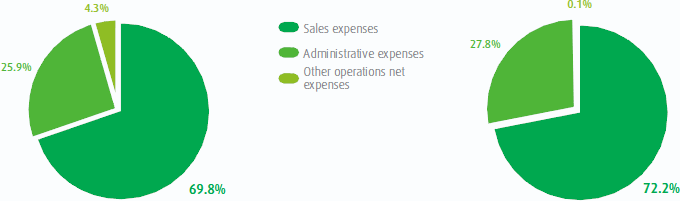
Administrative expenses increased by 27.9% over 2010, to R$ 28.8 million. The biggest components are personnel expenses and third party services (advice and consulting, temporary staff, travel expenses). These reached R$11.4 million and R$ 13.0 million respectively. This was caused by an increase in the administrative structure to support the company’s expansion.
In 2011, operational cash flow as measured by EBITDA (earnings before interest, tax, depreciation and amortization) was R$ 53.6 million, a margin of 4.7%. This represented a fall of 15% in EBITDA and 2.2 percentage point in the margin, mainly due to the increase in administrative expenses.
EBITDA
R$ million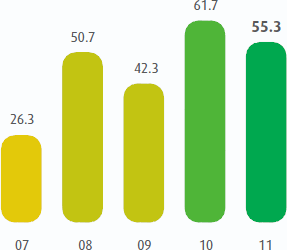
Financial activities showed a net loss of R$ 34.1 million, considering financial income of R$314.9 million and expenses of R$ 349.0 million. Main items in this account were (i) results of commodity hedging operations (derivatives and mark-to-market); (ii) passive forex losses, mainly caused by the increase in the value of the real in relation to the export currencies; and (iii) interest expenses. Compared with the previous year, financial expenses increased by R$ 79.5 million or 29.5%, of which forex losses alone accounted for 93.0% of the increase.
The increase in financial expenses during 2011 was partially offset by an increase in financial revenue of 51.0% to R$ 106.4 million. The biggest item were gains with derivatives and commodity price mark-to-market, which resulted in a R$270.0 miilion gain, vs R$ 165.9 million in the previous year. Net result for hedging during 2011 was a positivbe R$ 70.4 million, which confirms the efficacity of such operations as protection when selling physical soybeans.
The table that follows shows the financial items considered operational by the Company, adjusted for presentation in the EBIT/EBITDA results:
| Composição do Ajuste do EBIT/EBITDA (em R$ milhões) | 2011 |
|---|---|
| Resultado das operações com instrumentos financeiros de proteção | 70,4 |
| Resultado da variação cambial | ‐55,9 |
| Resultado financeiro líquido das operações de giro | ‐36,7 |
| Total | ‐22,2 |
This way, EBITDA already takes into consideration this item, leaving out as pure financing costs basically those expenses associated with financing long term investments and associated banking charges.
R$ million
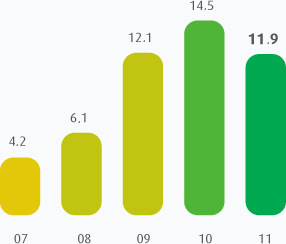
Net consolidated result for Algar Agro during 2011 was a net profit of R$ 25.6 million, practically unchanged from R$26.6 million in 2010. Margin over net sales was 2.3%, 0.6 pct below the 2010 margin, but still above the margin registered during the previous years.
Net Profit (R$ million) and Net Margin (%)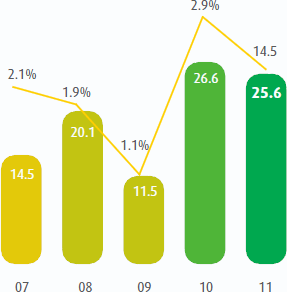
Debt
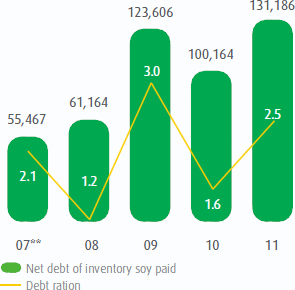
At the close of 2011, gross consolidated debt amounted to R$ 842.1 million and cash, to R$ 278.4 million, or a net debt of R$ 563.6 million. At the close of the previous year, net debt was R$ 464.0 miilion, increasing 21.5% in the period, following an increase in the volume of originated soybean.
Long term debt was R$ 214.8 million at year-end, with terms up to 2022. Most of the debt is represented by a credit line from the Fundo de Financiamento do Nordeste (FNE), started in 2005 and expiring in 2020 to support investments in the MAPITOPA region, including the new plant in the state of Maranhão. At the end of 2011, the balance of this credit line was R$ 111.2 million.
Short term loans, used to finance operations, totalled R$ 717.7 million at year end, an increase of 47.0% over year-end 2010 (R$ 488.2 million). The increase reflects an expansion in operations during 2011. Algar Agro’s activities involve large variations in working capital, mainly used to finance producing partner and for acquiring grains. Main financing items were Advances on Exchange Contracts (AEC) and pre-payments, totalling R$ 489.4 million, and export credits, totalling R$ 212.4 million.
| Net debt profile* 12/31/2011 – R$ 531.1 million |
Composition of short term debt 12/31/2011 – R$ 717.7 million |
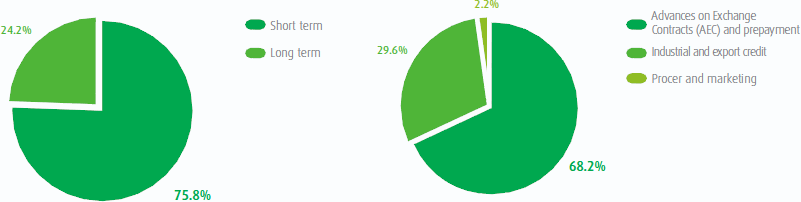
*Cash position at 31/12/2011 excluded from short term debt
| Financial indicators (R$ 000) | 2007 | 2008 | 2009 | 2010 | 2011 | 2011 x 2010 |
|---|---|---|---|---|---|---|
| Net sales | 676,480 | 1,068,954 | 1,035,680 | 910,624 | 1,132,520 | 24% |
| Operational expenses/income | ‐58,096 | ‐52,440 | ‐80,097 | ‐87,096 | ‐103,882 | 19% |
| Operacional Profit (EBIT) | 18,746 | 38,249 | 27,187 | 55,103 | 43,384 | ‐21.3% |
| EBITDA | 26,272 | 51,239 | 41,330 | 62,859 | 53,444 | ‐15.0% |
| Net financial results | 15,047 | ‐163,586 | ‐23,803 | ‐60,908 | ‐34,069 | ‐44% |
| Net profit (loss) | 14,491 | 20,135 | 11,488 | 26,566 | 25,591 | ‐4% |
| Total Assets | 578,829 | 1,084,278 | 1,075,213 | 1,121,677 | 1,376,209 | 23% |
| Net Assets | 133,514 | 153,249 | 314,774 | 330,858 | 350,371 | 6% |
| Net cash | 15,330 | 427,990 | 244,468 | 151,485 | 278,413 | 84% |
| Net debt from paid soybean stock | 55,467 | 61,164 | 123,606 | 100,164 | 131,186 | 31% |
| Debt reatio | 2.1 | 1.2 | 3.0 | 1.6 | 2.5 | 54% |
| ROE (%) | 11% | 13% | 4% | 8% | 7% | ‐9% |
| Margins (%) | ||||||
Gross Margin |
‐0.1% | 18.3% | 3.8% | 11.1% | 5.8% | ‐48% |
EBITDA Margin |
3.9% | 4.8% | 4.0% | 6.9% | 4.7% | ‐32% |
Net Margin |
2.1% | 1.9% | 1.1% | 2.9% | 2.3% | ‐23% |
top