In the next step, chlorine is added to the water. This substance is responsible for eliminating microorganisms in the water that are prejudicial to health, making the water suitable for consumption.
Aegea’s consolidated net revenue in 2015 totaled BRL795.1 million, with variation of 32.6% compared to BRL599.5 million in 2014. This result reflects the 9.5% increase in the customer base: 13.2% in billed volume for the year.
Costs and expenses
If the effect of amortization is not considered, the Company’s costs and expenses were 28.9% higher, which is BRL87.9 million more than in 2014.
This total can be explained by the higher rates charged by power companies and by the fiscal crisis which impacted the ability of public agencies to make payment. Despite these impacts, growth in total costs and expenses was less than revenue growth, showing gains in productivity.
Costs and expenses (BRL thousands)
2014
2015
Personnel
114,411
132,148
Outside services
50,760
54,373
Conservation and maintenance
7,041
8,976
Materials, equipment and vehicles
18,260
19,891
Cost of concession
5,626
16,584
Electricity
46,629
86,909
Chemical products
4,296
5,884
Travel and lodging
5,224
4,792
Provision for doubtful debts
6,405
29,481
Provisions for contingency
157
(5,133)
Research and development of new business (R&D)
17,924
9,013
Other costs
27,842
29,603
Subtotal
304,576
392,522
Amortization
56,157
88,315
Total
360,733
480,837
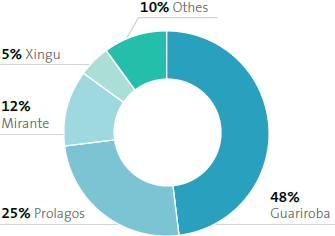
Energy costs grew significantly during the year, by around 86.4%. Of this amount, 14.6% is attributed to new companies and 71.8% to existing concessionaires, such as Águas Guariroba and Prolagos, due to an extraordinary price readjustment made by Brazil’s National Electric Energy Agency (Aneel), and to Águas de Matão, which achieved universal coverage of the concession area.
In relation to personnel costs, the staff at existing concessionaires was 4.6% smaller, with 105 fewer workers than the previous year. The result shows process improvements and more operational efficiency, especially with the expansion of Aegea Academy (learn more), aimed at enhancing skills at the strategic, tactical and operational levels and assure application of the Company’s Values in every phase of concession maturity.
Default
The 180-day default rate was 1.1% higher year-over-year in 2015. This increase can be credited to the government consumption category, which had higher share percentages in default, going from 14.9% in 2014 to 30.5% in 2015. Moreover, Aegea has monitored the national economic scenario, particularly numbers on jobs, earnings and consumer buying power and its impacts on its users’ capacity to make payment, especially its government customers. In order to bring these numbers down, the Company has intensified campaigns to encourage renegotiations of accounts past due, up by 16% year-over-year, and enrollment in automatic bill pay.
Operating income and Ebitda
Consolidated operating income for the year was BRL314 million, which represents year-over-year growth of 31.6%. Ebitda totaled BRL402 million, 36.5% higher than in 2014. This result was due to gains in efficiency, which contributed to lower personnel costs (see Costs and expenses).
Ebitda (BRL thousands)
2014
2015
Operating income
238.778
314.289
(+) Depreciation and amortization
56.157
88.315
Ebitda
294,935
402,604
Ebitda margin (%)
49.2
50.6
Net earnings
Aegea’s net earnings in 2015 were BRL115.156 million, a 2.6% increase compared to the previous year. This performance shows the ratio between the increased customer base and lower operating expenses. It was not more elastic due to an increase in the cost of electricity that was above the Company’s projections.
Cash flow
Cash flow from statement (BRL THOUSANDS)
Cash flow from operating activities
2013
2014
2015
Earnings before taxes
69,015
50,813
(34,471)
Adjustments for:
Amortization and depreciation
47
2,132
2,162
Interest on loans, financing and debentures
27,900
32,384
25,122
Fair value adjustments to loans and financing
0
0
5,662
Exchange rate loss
0
0
41,898
Derivatives
0
0
(34,869)
Interest on financial investments
(15,009)
(23,537)
(23,560)
Result of equity accounting
(132,339)
(130,626)
(147,968)
Changes in assets and liabilities (Increase)/Decrease of assets
Customer accounts receivable
(26,216)
(58,659)
(58,203)
Inventories
(2,622)
934
(1,558)
Current and noncurrent fiscal assets
12,166
(17,130)
(12,222)
Advances to suppliers
0
(4,729)
(7,640)
Other credits
(10,284)
(843)
(20,383)
Increase/(Decrease) of liabilities
Suppliers and contractors
(5,806)
31,287
16,590
Labor and social obligations
2,571
8,912
6,082
Tax obligations
(2,857)
8,080
(3,223)
Tax payments
(3,148)
(1,661)
452
Payment of contingencies
(129)
(500)
(4,080)
Other accounts payable
(70,547)
1,963
(18,292)
Interest paid
(76,822)
(98,487)
(131,274)
Income tax and social contribution paid
(48,179)
(43,842)
(72,197)
Cash flows from investment activities
Financial investments and debentures
(273,352)
48,716
191,932
Dividends and interest received on shareholders’ equity
0
1,000
1,570
Investment losses
0
173
0
Acquisition of fixed assets
(14,030)
(8,566)
(3,177)
Acquisition of intangible assets
(175,848)
(386,822)
(338,668)
Advance for acquisition of business
0
(12,500)
0
Acquisition of the Agência Ambiental controlled
company, net cash obtained in the acquisition
0
(29,788)
0
Cash flows from financing activities
Loans, financing and debentures raised
185,067
7,000
150,000
Loans, financing and debentures paid
(185,585)
(350)
157,936
Current accounts receivable from related parties
(26,087)
(41,536)
(70,352)
Dividends paid
(86,000)
(86,000)
(123,820)
Capital investments by minority shareholders
in controlled companies
287,775
0
0
Net increase (decrease) in cash and cash equivalents
(14,908)
(3,894)
5,012
Initial Balance of Cash and Cash Equivalents
18,933
4,025
131
Final Balance of Cash and Cash Equivalents
4,025
131
5,143
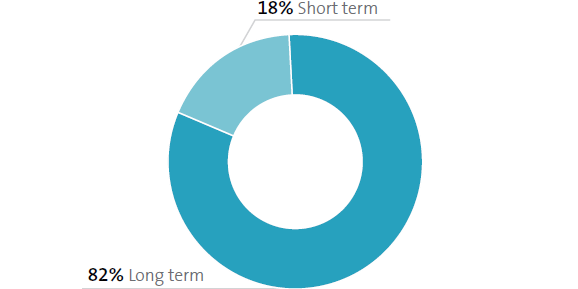
Indebtedness
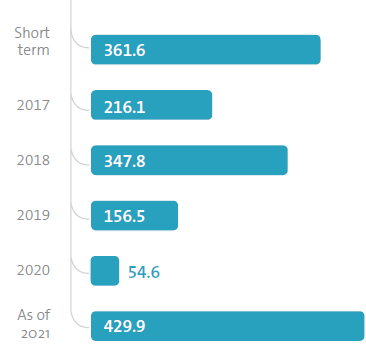
The balance of cash and cash equivalents and short and long-term financial investments ended the year at a total of BRL395.8 million. Gross debt (including hedging) for the same period was BRL1.6 billion.
Indebtedness (BRL thousands)
2014
2015
(%)
Ebitda
294,935
402,604
36.5
Net debt
815,756
1,170,578
43.5
(+) Gross debt (including hedging)
1,343,463
1,566,361
16.6
(-) Cash
(527,707)
(395,783)
-25.0
Net debt/Ebitda
2.77
2.91
Reduced cash flow is the result of an accelerated curve of capital expenses (CAPEX), the outcome of which is a lower financial yield than in 2014.
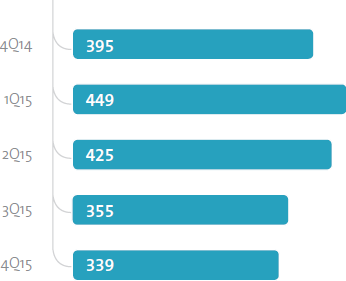
CAPEX BRL millions
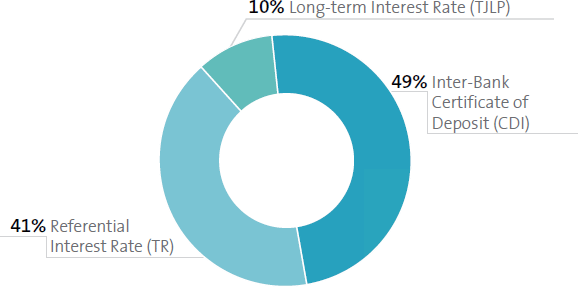
Debt distribution profile
Timeline of amortization of debts (BRL millions) – Others