
Bradesco’s economic and financial performance stems from measures related to strategic planning aimed at producing sustainable results at the best risk and return ratio. Its robust performance has provided shareholders with significant returns since the Organization was founded. This trend may be verified by the different numbers and indicators presented in its quarterly results reports.
The macroeconomic context, industry policies and the regulatory framework have an important impact on Banco Bradesco operations. The general level of economic activity, monetary policy regarding the basic interest rate and compulsory deposits, the level of inflation, variations in exchange rates, among a series of other variables, impact the speed of the expansion of credit, the level of delinquency and the results of financial intermediation, for example. Recent examples are the macroprudential measures which altered the capital requirements for financing vehicles, changes in taxes on financial operations (IOF) involving the concession of loans and overseas fund raising, the change in the rules for the remuneration of savings accounts, the interest rates and maximum terms for payroll credit, the rules on sharing systems for credit card transactions and the changes in the liabilities and remuneration of compulsory deposits. Also of importance is the implementation of the Basel III rules, modifying a wide-ranging set requirements related to capital, liquidity and risk controls, among others. In this context, Bradesco has shown that it has the capacity and is prepared to comply with alterations in the regulatory environment.
Regarding external commitments, Bradesco publishes an annual guidance with its end of year results containing projections and estimates elaborated in accordance with the accounting practices in place in Brazil, aligning its strategic planning with respect to: the total loan portfolio and its breakdown by individuals and corporations, net interest income (interest earning portion), fee and commission income, operating expenses (personnel + administrative), insurance premiums and allowances for loan losses. See the guidance.
Evidently there are factors which are influenced by management, such as: (i) contract and cost adjustments in accordance with business growth and the Organization’s investment plan; (ii) expansion of the Bradesco service network; (iii) estimates that do not take into account new partnerships or acquisitions; and (iv) business growth in line with company strategy. There are also factors beyond management control, such as: (i) maintenance of the fundaments of current macroeconomic policy; (ii) resumption of growth in the global economy; (iii) use of the Selic interest rate by Copom to control inflation; (iv) evolution of the loan market; (v) liquidity conditions to fulfill the demand for loans; and (vi) regulatory controls that impact banking management.
The Bradesco Organization has diverse Executive Committees with specific areas of activity defined in their respective regimes, which were introduced with the objective of establishing guidelines to be followed in diverse segments of the Organization, as well as to enhance corporate governance practices. Some of these are subordinated to the Board of Directors, periodically reporting the results of their activities to the Board.
Among the diverse committees supporting decision making and aiding executives in doing business, particularly worthy of note is the Efficiency Committee, responsible for assessing the Organization’s expenses, revenues, processes and investments aimed at optimizing processes and propagating best practices focused on efficiency, as well as measuring results by means of the Operating Efficiency Ratio with a view to driving the best possible performance and maximizing returns for the business units.
Investments in technology, which have exceeded R$29 billion in the last nine years, have enabled the Organization to drive operating efficiency gains, such as a 50% increase in the speed of conceiving and developing new products, reductions in back office activities and a 20% decrease in systems development and maintenance costs. Operational sub-segmentation in the retail area, implanted in 2015, has permitted improvements in client service, enabling higher fees to be charged and consequently increasing fee income.
Management measures worthy of note include monitoring of the performance indicators, such as the Operating Efficiency Ratio (ER), profitability (ROAE), coverage of operating expenses vis-à-vis fee income, return on average assets (Average Net Interest Margin) as well as insurance, pension and capitalization bond activities, such as commercialization and claims. The results are disclosed on a quarterly basis in the Report on Economic and Financial Analysis and have been showing robust performance, in line with the Organization’s strategic goals.
The Organization’s social and environmental investments take place on two major fronts: investment in education via the Fundação Bradesco and social and environmental investments aimed at fomenting initiatives implanted by strategic stakeholders in alignment with the business. These projects are directly related with the businesses, such as financial education, and the promotion of products with social and environmental differentials, such as affinity cards and capitalization bonds linked with socially and environmentally oriented organizations. Furthermore, a socially and environmentally oriented strategic goal was developed in the Organization, accompanied by initiatives to enhance performance through improvements in governance, management and reporting. These measures will be applied gradually and will be monitored by means of indicators and targets.
Bradesco has its Corporate Standards for Sponsorships and Participation in Events, which establish the social and environmental principles for these types of actions while incorporating commercial or relationship ends. There is also the Corporate Standard for Social and Environmental Investments, which sets forth guidelines for Bradesco’s social and environmental investments.
Lastly, to manage impacts on climate change in the value chain, in 2015 the bank worked in partnership with CEBDS on a carbon management program in the value chain. The initiative is aimed at preparing suppliers having a major impact on climate change to conduct greenhouse gas (GHG) inventories. A total of 26 suppliers participated in the course.
With its nationwide presence and capillarity, Bradesco supports projects in all the regions in the country, examples being:
- Economic-financial results: fiscal incentive laws are used to fund projects promoting social well-being, with the bank’s own capital supplementing funding from incentive laws.
- Stakeholder engagement: donations and sponsorship permit Bradesco to expand relationship with diverse stakeholders. They enable even greater interaction between the branch network/insurance branch offices and the communities in which they operate.
- Fundação Amazonas Sustentável (FAS): with support from Bradesco, FAS projects help improve income, education, healthcare and entrepreneurship among more than 9,400 families, fostering local development and environment preservation.
- SOS Mata Atlântica and Tamar Project: these projects promote the conservation of biological and cultural diversity in the Atlantic Rainforest biome, respectively driving social and environmental awareness and the conservation of sea turtles.
- Affinity Cards: Fundação SOS Mata Atlântica, Associação de Assistência à Criança Deficiente (AACD), Associação de Pais e Amigos dos Excepcionais (APAE), Casas André Luiz and Fundação Amazonas Sustentável (FAS).
| Highlights | 2012 | 2013 | 2014 | 2015 | Variation % | |
|---|---|---|---|---|---|---|
| 2015 x 2012 | 2015 x 2014 | |||||
| Adjusted income statement for the period (R$ million)1 | ||||||
Book net income |
11,381 | 12,011 | 15,089 | 17,190 | 51.0 | 13.9 |
Adjusted net income |
11,523 | 12,202 | 15,359 | 17,873 | 55.1 | 16.4 |
Total net interest income |
43,793 | 43,286 | 48,295 | 55,387 | 26.5 | 14.7 |
Gross credit margin |
33,464 | 35,127 | 38,366 | 42,788 | 27.9 | 11.5 |
Net credit margin |
20,450 | 23,082 | 25,709 | 27,614 | 35.0 | 7.4 |
Provision for loan losses |
(13,014) | (12,045) | (12,657) | (15,174) | 16.6 | 19.9 |
Fee and commission income |
17,512 | 19,786 | 22,089 | 24,839 | 41.8 | 12.4 |
Administrative and personnel expenses |
(26,348) | (27,573) | (28,815) | (31,038) | 17.8 | 7.7 |
Insurance written premiums, pension plan contributions and capitalization bond income |
44,308 | 49,752 | 56,152 | 64,612 | 45.8 | 15.1 |
| Statement of financial position (R$ million)1 | ||||||
Total assets1 |
879,092 | 908,139 | 1,032,040 | 1,079,755 | 22.8 | 4.6 |
Securities |
315,487 | 313,327 | 346,358 | 407,584 | 29.2 | 17.7 |
Loan operations2 |
385,529 | 427,273 | 455,127 | 474,027 | 23.0 | 4.2 |
- Individual |
117,540 | 130,750 | 141,432 | 147,749 | 25.7 | 4.5 |
- Corporate |
267,989 | 296,523 | 313,695 | 326,278 | 21.8 | 4.0 |
Allowance for Loan Losses (ALL)3 |
(21,299) | (21,687) | (23,146) | (29,499) | 38.5 | 27.4 |
Total deposits |
211,858 | 218,063 | 211,612 | 195,760 | (7.6) | (7.5) |
Technical reserves |
124,217 | 136,229 | 153,267 | 177,835 | 43.2 | 16.0 |
Shareholders’ equity |
70,047 | 70,940 | 81,508 | 88,907 | 26.9 | 9.1 |
Assets under management |
1,225,228 | 1,260,056 | 1,426,099 | 1,510,396 | 23.3 | 5.9 |
| Performance indicators for adjusted net income (% unless otherwise stated) | ||||||
Adjusted net income per share (R$)4 |
2.29 | 2.42 | 3.05 | 3.55 | 55.0 | 16.4 |
Book value per share (common and preferred– R$)4 |
13.90 | 14.09 | 16.19 | 17.68 | 27.2 | 9.2 |
Return on average equity5, 6 |
19.2 | 18.0 | 20.1 | 20.5 | 1.3 p.p. | 0.4 p.p. |
Annualized return on common equity to 11% – BIS III6 |
- | - | 24.2 | 27.4 | 27.4 p.p. | 3.2 p.p. |
Annualized return on average assets6 |
1.4 | 1.4 | 1.6 | 1.7 | 0.3 p.p. | 0.1 p.p. |
Average rate 12-month (adjusted net interest income/total average assets – repos – permanent assets) |
7.6 | 7.0 | 7.3 | 7.5 | (0.1) p.p. | 0.2 p.p. |
Fixed assets ratio7 |
44.6 | 45.4 | 47.2 | 35.2 | (9.4) p.p. | (12.0) p.p. |
Combined ratio – insurance8 |
86.0 | 86.1 | 86.1 | 86.7 | 0.7 p.p. | 0.6 p.p. |
Operating efficiency ratio (ER) |
41.5 | 42.1 | 39.2 | 37.5 | (4.0) p.p. | (1.7) p.p. |
Coverage ratio ( fee and commission income/administrative and personnel expenses) |
66.5 | 71.8 | 76.7 | 80.0 | 13.5 p.p. | 3.3 p.p. |
Basel ratio – total9 |
16.1 | 16.6 | 16.5 | 16.8 | 0.7 p.p. | 0.3 p.p. |
Market capitalization (R$ million)10 |
131,908 | 128,085 | 145,536 | 100,044 | (24.2) | (31.3) |
| Loan portfolio quality (%)11 | ||||||
ALL/loan portfolio3 |
7.3 | 6.7 | 6.7 | 8.0 | 0.7 p.p. | 1.3 p.p. |
Non-Performing loans (> 60 days12/loan portfolio) |
5.0 | 4.2 | 4.3 | 5.0 | 0.0 p.p. | 0.7 p.p. |
Delinquency ratio (> 90 days12/loan portfolio) |
4.1 | 3.5 | 3.5 | 4.1 | (0.0) p.p. | 0.6 p.p. |
Coverage ratio (> 90 days12)3 |
178.2 | 192.3 | 189.0 | 198.0 | 19.8 p.p. | 9.0 p.p. |
Coverage ratio (> 60 days12)3 |
147.3 | 158.9 | 156.6 | 161.7 | 14.4 p.p. | 5.1 p.p. |
| Other information | ||||||
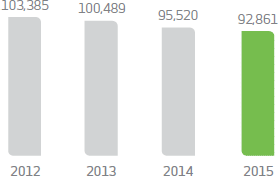
Employees13 |
103,385 | 100,489 | 95,520 | 92,861 | (10.2) | (2.8) |
Outsourced employees and interns |
12,939 | 12,614 | 12,916 | 13,223 | 2.2 | 2.4 |
Branches |
4,686 | 4,674 | 4,659 | 4,507 | (3.8) | (3.3) |
PAs14 |
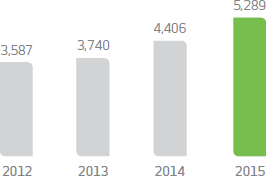
3,781 | 3,586 | 3,486 | 3,511 | (7.1) | 0.7 |
PAEs14 |
1,456 | 1,180 | 1,145 | 736 | (49.5) | (35.7) |
External ATM network points – Bradesco15, 16 |
3,809 | 3,003 | 1,344 | 627 | (83.5) | (53.3) |
Banco24Horas Network points15 |
10,818 | 11,583 | 12,450 | 11,721 | 8.3 | (5.9) |
Bradesco Expresso (correspondent banks) |
43,053 | 46,851 | 50,006 | 43,560 | 1.2 | (12.9) |
ATMs (Bradesco and Banco24Horas networks) |
47,834 | 48,203 | 48,682 | 50,467 | 5.5 | 3.7 |
Active account holders (million)17, 18 |
25.7 | 26.4 | 26.5 | 26.0 | 1.2 | (1.9) |
Savings account holders (million)19 |
48.6 | 50.9 | 59.1 | 60.1 | 23.7 | 1.7 |
|
1. For further information please refer to explanatory note 4 – Statement of Financial Position and Statement of Managerial Income for year ended on December 31, 2015. 2. Expanded loan portfolio, includes sureties and guarantees, letters of credit, advances of credit card receivables, co-obligation of loan assignments (FIDC credit right investment funds and CRI- certificates of real estate receivables), co-obligation of rural loan assignments and operations involving credit risk – commercial portfolio, including debentures and promissory note transactions. 3. Includes provision for guarantees provided, encompassing sureties, guarantees, letters of credit, and standby letters of credit, comprising the concept of excessive ALL. 4. For purposes of comparison, shares were adjusted in accordance with bonuses and share splits. 5. Excluding mark-to-market effect of Available-for-Sale Securities recorded under Shareholders’ Equity. 6. Adjusted net income. 7. From March 2015, considers the ratio calculated based on prudential consolidated in accordance with CMN Resolution nº 4.192/13. 8. Excludes additional provisions. 9. From October 2013, the calculation of the Basel ratio is in accordance with the regulatory guidelines of CMN resolutions nº 4.192/13 and nº 4.193/13 (Basel III). 10. Number of shares (excluding treasury shares) multiplied by the closing price for common and preferred shares on the period’s last trading day. 11. Concept defined by the Brazilian Central Bank (Bacen). 12. Overdue loans. 13. In 2014, includes the transfer of 2,431 Scopus Tecnologia employees to IBM Brasil. 14. PAs (Service branch): resulting from the consolidation of Bank Service branch (PAB), Advanced Service Points (PAA) and exchange branches, in accordance with CMN Resolution nº 4,072/12; and in-company ATMs (PAE): points located in company with electronic service. 15. Includes points shared between the Bradesco network and the Banco24Horas network. 16. The reduction was due to the sharing of external network ATMs by the Banco24Horas Network ATMs. 17. Number of single clients (individual and corporate). 18. Refers to the first and second checking account holders. 19. Number of accounts. |
||||||
| (R$ million) | 2012 | 2013 | 2014 | 2015 | Variation % | |
|---|---|---|---|---|---|---|
| 2015 x 2012 | 2015 x 2014 | |||||
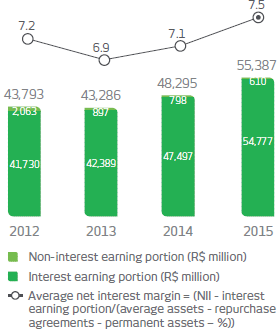
| Net interest income | 43,793 | 43,286 | 48,295 | 55,387 | 26.5 | 14.7 |
- Interest earning portion |
41,730 | 42,389 | 47,497 | 54,777 | 31.3 | 15.3 |
- Non-interest earning portion |
2,063 | 897 | 798 | 610 | (70.4) | (23.6) |
| Provision for loan losses (ALL) | (13,014) | (12,045) | (12,657) | (15,174) | 16.6 | 19.9 |
| Gross income from financial intermediation | 30,779 | 31,241 | 35,638 | 40,213 | 30.7 | 12.8 |
| Income from insurance premiums, pension plans and capitalization bonds, net of variation in technical reserves, retained claims and others* | 3,814 | 4,471 | 5,047 | 5,426 | 42.3 | 7.5 |
| Fee and commission income | 17,512 | 19,786 | 22,089 | 24,839 | 41.8 | 12.4 |
| Personnel expenses | (12,186) | (13,061) | (13,967) | (14,699) | 20.6 | 5.2 |
| Other administrative expenses | (14,162) | (14,512) | (14,848) | (16,339) | 15.4 | 10.0 |
| Tax expenses | (4,139) | (4,381) | (4,627) | (5,640) | 36.3 | 21.9 |
| Equity in the earnings (losses) of unconsolidated companies | 148 | 43 | 187 | 144 | (2.7) | (23.0) |
| Other operating income /(expenses) | (4,214) | (4,743) | (5,395) | (6,708) | 59.2 | 24.3 |
| Operating result | 17,552 | 18,844 | 24,124 | 27,236 | 55.2 | 12.9 |
| Non-operating results | (89) | (120) | (183) | (283) | 218.0 | 54.6 |
| Income Tax/Social Contribution | (5,872) | (6,425) | (8,469) | (8,933) | 52.1 | 5.5 |
| Non-controlling interest | (68) | (97) | (113) | (147) | 116.2 | 30.1 |
| Adjusted net income | 11,523 | 12,202 | 15,359 | 17,873 | 55.1 | 16.4 |
| *“Others”, includes: draws and redemption of capitalization bonds and expenses with insurance sales, pension plans and capitalization bonds. | ||||||
| Book net income x adjusted net income (R$ million) | 2012 | 2013 | 2014 | 2015 | |
|---|---|---|---|---|---|
| Book net income | 113,81 | 12,011 | 15,089 | 17,190 | |
| Non-recurring events (net of tax effects) | 142 | 191 | 270 | 683 | |
Tax credit |
(1,389) | (462) | - | (2,341) | |
Constitution/(reversal) of technical reserves |
1,211 | (1,471) | (432) | (276) | |
Additional ALL/worsening of rating |
- | - | - | 2,222 | |
Contingent liabilities |
108 | 58 | (98) | 606 | |
Impairment of assets* |
885 | 451 | 800 | 472 | |
Law nº 12,865/13 (REFIS) |
- | (1,950) | - | - | |
Rate adjustment at market value – NTNs |
- | 3,565 | - | - | |
Income from extension of terms of securities |
(1,306) | - | - | - | |
Divestment of Serasa shares |
(523) | - | - | - | |
Full amortization of goodwill – BERJ |
1,156 | - | - | - | |
| Adjusted net income | 11,523 | 12,202 | 15,359 | 17,873 | |
| *Refers basically to the impairment of: (i) shares in the amount of R$238 million (2014 – R$749 million; 2013 – R$361 million; 2012 – R$536 million); and (ii) permanent/intangible assets amounting to R$234 million (2014 – R$51 million; 2013 – R$90 million; 2012 – R$316 million). | |||||
INCOME ORIGINATION
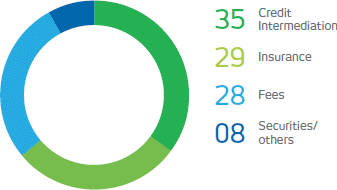
In its daily operations, Bradesco strives to maintain a balance, with different businesses and sources of income as a means of diversifying the risks inherent to its activities. It operates mainly on two fronts: in the banking/financial area and in insurance, supplementary pension plans and capitalization bonds. They account respectively for 70.4% and 29.6% of the Organization’s results. This ensures a secure diffusion of income, encompassing loans, investments, asset management, corporate and private banking, cards, consortiums, insurance, supplementary pensions, capitalization bonds and others.
The following graphs show the breakdown of the Organization’s net income:
12M15 (%)
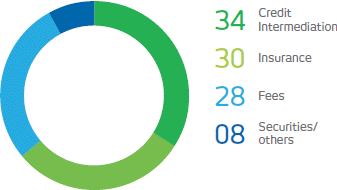
12M14 (%)
NET INCOME AND PROFITABILITY
Shareholders’ equity totaled R$88,907 million in December 2015, growing 9.1% compared with December 2014.
In spite of a very volatile and adverse environment in 2015, the Organization managed to obtain a return on average equity (ROAE) of 20.5%, underscoring its excellent performance in management, efficiency and cost control.
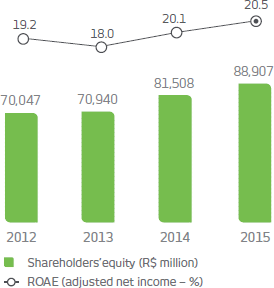
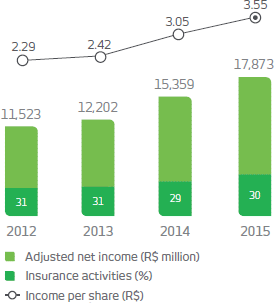
Adjusted net income for the period was
R$17,873 million (16.4% up on the adjusted net income of R$15,359 million in 2014), corresponding to R$3.55 per share.
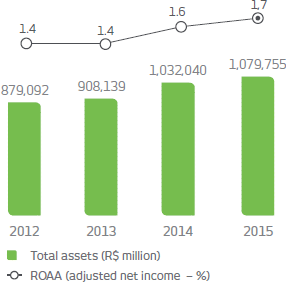
Total assets reached R$1.080 trillion in December 2015, growing 4.6% over December 2014, driven by increased business volume. The return on average assets (ROAA) was 1.7%, an increase of 0.1 p.p. over December 2014 (1.6%).
ADDED VALUE STATEMENT GRI G4-EC11
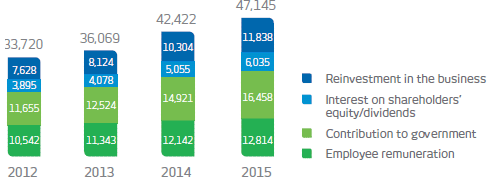
The added value represents how much wealth the Organization produces and how this wealth is distributed in society year on year. Worthy of note is the growth in added value for shareholders, in remuneration of work and in contributions to the government.
In December 2015, added value totaled R$47,145 million, up 11.1% compared with the previous year: (i) R$16,458 million, or 34.9% went to the government in the form of contributions, taxes and fees; (ii) R$12,814 million, or 27.2% corresponded to employee remuneration; (iii) R$11,838 million, or 25.1%, was reinvested; and (iv) R$6,035 million, or 12.8% was distributed to shareholders in interest and dividend payments.
1. Based on the Adjusted Income Statement.
VALUE ADDED STATEMENT (R$ MILLION)
BASEL Ratio – BASEL III
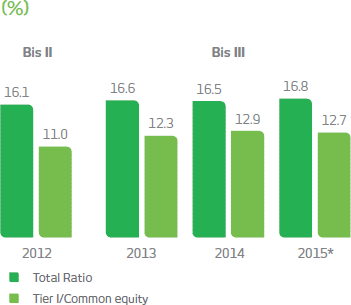
Bradesco’s capital structure is compliant with Basel III requirements, ensuring that management is better positioned to achieve strategic targets and inspire trust and peace of mind for shareholders and investors.
In December 2015, Reference Equity totaled R$102,825 million, compared with risk weighted assets of R$612,217 million, resulting in a Total Basel Ratio of 16.8% and common equity of 12.7%.
The Total Basel Ratio increased 0.3 p.p. compared with the previous year, impacted basically (i) by the increase in shareholders’ equity due to the higher results in the year and (ii) by the issuance of subordinate debts; and partially offset, (iii) by the increased risk-weighted assets, mainly in credit risk, driven by the loan portfolio expansion, and (iv) by the application of a factor of 40% in prudential adjustments (the factor applied in 2014 was 20%), in accordance with CMN Resolution n° 4,192/13. These factors, with the exception of the increase in shareholders’equity and the issuance of subordinate debt, contributed to the 0.2 p.p. reduction in Tier I common equity.
*From October 2013, Capital started being calculated based on CMN Resolution nº 4,192/13, which determines that the calculation be based on the Consolidated Financial Results until December 2014 and on the Prudential Consolidated Results as per January 2015. The difference in the new calculation consists essentially of the consolidation of companies similar to financial institutions (Bradesco Consórcios, Cielo, among others) and investment funds.
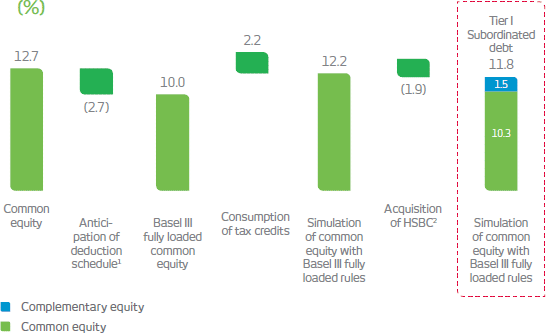
FULL IMPACT – BASEL III
There follows a simulation for Basel III, considering some of the main future adjustments, which include: (i) the application of 100% of the deductions in the implantation schedule; (ii) the reallocation of funds by payment of dividends by the insurance business; (iii) the realization of tax credits; and (iv) the impact of the acquisition of HSBC, resulting in a common equity rate of 10.3%, which, with funding via subordinate debt, may total a Tier I Basel Ratio of approximately 11.8% at the end of 2018.
2. Under analysis by the regulatory authorities.
TIER I CAPITAL BUFFER MARGIN/TIER I RETURN ON CAPITAL
Bradesco maintains and continually improves its methodology for measurement and processes for the implementation of buffer capital, aimed at maintaining suitable levels of capital to address the risks incurred.
For the medium and long term, the Organization considers it to be comfortable to maintain a Tier I buffer capital margin of at least 25% compared with the regulatory minimum capital, following the timetable established by the Central Bank for the full adoption of the Basel III guidelines.
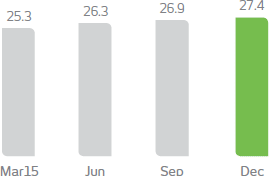
Considering the 11% minimum common equity required under the full Basel III rules, profitability would be 27.4%.
RETURN ON COMMON EQUITY - 11%* (%)
NET INTEREST INCOME
In 2015, net interest income was R$55,387 million, up R$7,092 million, due basically to (i) the higher interest earning portion, amounting to R$7,280 million, and offset (ii) by the reduction of the non-interest earning portion by R$188 million.
EARNING PORTION OF NET CREDIT INTERMEDIATION
In 2015, the Earning Portion Of Net Credit Intermediation (which presents the income from interest net of the Allowance for Loan Losses– ALL) remained at a sustainable level, in spite of the adverse economic conjuncture in Brazil. This reflects the strengthening of the loan concession policy and processes, the quality of the guarantees obtained, the enhancement of credit recovery processes and improvements of the policies of credit concession.
Comparing 2015 with the previous year, the net margin grew 7.4% due to the increase (i) in the average spread and (ii) the average volume of business; and offset (iii) by the effect of the alignment of the level of provisioning in certain operations with corporate clients and (iv) the increase in delinquency in the period.
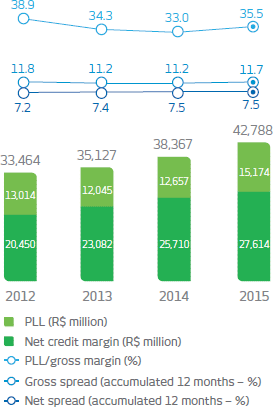
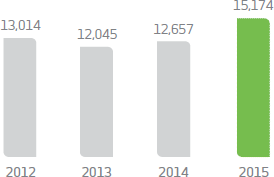
PROVISION FOR LOAN LOSSES
In 2015, the provision for loan losses net of recoveries was R$15,174 million, a variation of 19.9% impacted mainly: (i) by the effect of the alignment of the level of provisioning in certain operations with corporate clients; (ii) by the increase in delinquency in the period; and (iii) by the increase in credit operations – Bacen concept –, which grew 5.9% in the last 12 months.
The effects of the worsened delinquency were mitigated by the strengthening of the loan concession policy and processes and by the quality of the guarantees obtained, as well as the improvement of credit recovery processes and diversification of the product mix.
(R$ million)
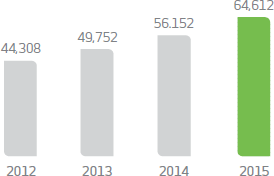
INSURANCE WRITTEN PREMIUMS, PENSION PLAN CONTRIBUTIONS AND CAPITALIZATION BOND INCOME
Net income in 2015 was R$5,289 million, 20% up on the previous year (R$4.406 million), due to: (i) a 15.1% increase in revenues and (ii) a 23.8% increase in financial income; and offset in part, (iii) by the 19.9% rise in retained claims.
Income from insurance written premiums, pension plan contribution and capitalization bonds was R$64,612 million, an increase of 15.1% compared with 2014, influenced mainly by the performance of the Health and Life and Pension segments, which grew respectively by 20.1% and 18.1%. Technical reserves reached R$177,835 million, growing 16% against December 2014.
These results reflect the Insurance Group strategy, notably the expansion of products and services, the new specialization strategy for brokers, who now commercialize multiple products, improvements in client service and synergies with the branches.
NET INCOME
(R$ MILLION)
INSURANCE WRITTEN PREMIUMS, PENSION PLAN CONTRIBUTIONS AND CAPITALIZATION BOND INCOME (R$ MILLION)
| R$ Million (unless otherwise stated) | 2012 | 2013 | 2014 | 2015 | Variation % | |
|---|---|---|---|---|---|---|
| 2015 x 2012 | 2015 x 2014 | |||||
| Net income | 3,587 | 3,740 | 4,406 | 5,289 | 47.4 | 20.0 |
| Insurance written premiums, pension plan contributions, and capitalization bond income | 44,308 | 49,752 | 56,152 | 64,612 | 45.8 | 15.1 |
| Technical reserves | 124,217 | 136,229 | 153,267 | 177,835 | 43.2 | 16.0 |
| Financial assets | 141,540 | 146,064 | 166,022 | 191,921 | 35.6 | 15.6 |
| Claims ratio (%) | 71.0 | 71.2 | 71.0 | 72.0 | 1.0 p.p. | 1.0 p.p. |
| Combined ratio (%)1 | 86.0 | 86.1 | 86.1 | 86.7 | 0.7 p.p. | 0.6 p.p. |
| Policyholders/participants and clients (thousands) | 43,065 | 45,675 | 46,956 | 49,806 | 15.7 | 6.1 |
| Employees (unit) | 7,554 | 7,383 | 7,113 | 7,023 | (7.0) | (1.3) |
| Market share of Insurance written premiums, pension plan contributions, and capitalization bond income (%)2, 3 | 24.8 | 24.2 | 24.4 | 25.5 | 0.7 p.p. | 1.1 p.p. |
| 1. Excludes additional provisions. 2. Source: Susep/ANS. 3. In 2015, includes the latest data released by SUSEP (November/15). | ||||||
The high level of technical reserves guarantees that policyholders will receive their premiums in the future, particularly in the areas of health, life and pension plans.
FEE INCOME
This is one of Bradesco’s main income sources. It has been growing steadily with excellent prospects for continued expansion, mainly due to the improvement of the client segmentation process.
In 2015, fee income totaled R$24,839 million, growing R$2,750 million, or 12.4%, compared with 2014, driven mainly, (i) by the increased volume of operations due to ongoing investments in service channels and technology, and (ii) by progress in the client segmentation process, to ensure an improved offering of products and services.
The revenues that most contributed to this result were from: (i) the robust performance in card activities, due to (a) the higher financial transaction volume and (b) the higher number of transactions; (ii) growth in checking account revenues, resulting basically from the improvement of client segmentation; and the growth in revenues from (iii) credit operations, driven mainly by the income from collaterals, (iv) consortium management and (v) fund management.
| (R$ MILLION) | 2012 | 2013 | 2014 | 2015 | Variation % | |
|---|---|---|---|---|---|---|
| 2015 x 2012 | 2015 x 2014 | |||||
Card income |
6,025 | 7,165 | 8,129 | 9,612 | 59.5 | 18.2 |
Checking accounts |
3,245 | 3,608 | 4,021 | 4,946 | 52.4 | 23.0 |
Loan operations |
2,080 | 2,242 | 2,582 | 2,801 | 34.7 | 8.5 |
Fund management |
2,172 | 2,324 | 2,449 | 2,617 | 20.5 | 6.9 |
Collection |
1,314 | 1,471 | 1,566 | 1,574 | 19.8 | 0.5 |
Consortium management |
613 | 722 | 880 | 1,040 | 69.7 | 18.2 |
Custody and brokerage services |
483 | 511 | 520 | 557 | 15.3 | 7.1 |
Underwriting/financial advisory services |
517 | 568 | 637 | 541 | 4.6 | (15.1) |
Payments |
319 | 340 | 373 | 383 | 20.1 | 2.7 |
Others |
745 | 835 | 931 | 767 | 3.0 | (17.6) |
| Total | 17,512 | 19,786 | 22,089 | 24,839 | 41.8 | 12.4 |
PERSONNEL EXPENSES
In 2015, personnel expenses totaled R$14,699 million, up R$732 million, or 5.2%, over the previous year, due mainly to the increase in the structural portion, related to higher expenses with salaries, social charges and benefits, the result of the higher salary levels deriving from the 2014 and 2015 collective bargaining agreements.
PERSONNEL EXPENSES(R$ MILLION)
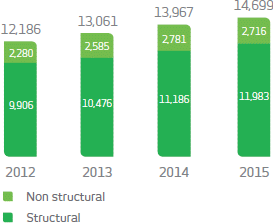
EMPLOYEES*
Obs.: Structural = salaries + social charges + benefits + pension plan; and
Non structural = Profit sharing plan + training + Labor provision + severance costs.
*2014 includes the transfer of 2,431 Scopus Tecnologia employees to IBM Brasil.
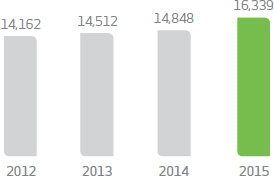
ADMINISTRATIVE EXPENSES
Due to the efforts of the Efficiency Committee, Bradesco has been able to maintain its administrative expenses at a controlled level, helping to improve the Operating Efficiency Ratio. In 2015, administrative expenses totaled R$16,339 million, 10% higher than in 2014, due basically to expenses arising from: (i) the growth in business and service volume during the year; (ii) from contract adjustments; and (iii) and the variation in the dollar, which appreciated 47% against the real in the last 12 months. Worthy of note was the ongoing control exercised by the Efficiency Committee, whose initiatives helped rebalance personnel and administrative expenses.
ADMINISTRATIVE EXPENSES (R$ MILLION)
SERVICE POINTS (UNIT)*
*The reduction is due to the migration of Bradesco ATM Network External Points to the Banco24Horas network, to the deactivation of ATMs from Banco24Horas Network and the decrease in Bradesco Expresso correspondents.
BREAKDOWN OF PERSONNEL AND ADMINISTRATIVE EXPENSES
In 2015, personnel and administrative expenses totaled R$31,038 million, an increase of 7.7% compared with previous year, growing below than the inflation rate
| (R$ million) | 2012 | 2013 | 2014 | 2015 | Variation % | |
|---|---|---|---|---|---|---|
| 2015 x 2012 | 2015 x 2014 | |||||
| Personnel expenses | ||||||
| Structural | 9,906 | 10,476 | 11,186 | 11,983 | 21.0 | 7.1 |
Salaries/social charges |
7,427 | 7,798 | 8,282 | 8,834 | 18.9 | 6.7 |
Benefits |
2,479 | 2,678 | 2,904 | 3,149 | 27.0 | 8.4 |
| Non structural | 2,280 | 2,585 | 2,781 | 2,716 | 19.1 | (2.3) |
Management and employee profit share |
1,335 | 1,407 | 1,536 | 1,580 | 18.4 | 2.9 |
Provision for labor claims |
650 | 806 | 793 | 705 | 8.5 | (11.1) |
Training |
132 | 127 | 145 | 145 | 9.8 | - |
Severance costs |
163 | 245 | 307 | 286 | 75.5 | (6.8) |
| Total | 12,186 | 13,061 | 13,967 | 14,699 | 20.6 | 5.2 |
| Administrative expenses | ||||||
Outsourced services |
3,537 | 4,134 | 3,942 | 4,124 | 16.6 | 4.6 |
Depreciation and amortization |
1,593 | 1,665 | 1,906 | 2,121 | 33.1 | 11.3 |
Communication |
1,662 | 1,608 | 1,524 | 1,653 | (0.5) | 8.5 |
Data processing |
1,115 | 1,297 | 1,342 | 1,600 | 43.5 | 19.2 |
Advertising and marketing |
799 | 793 | 934 | 1,064 | 33.2 | 13.9 |
Asset maintenance |
608 | 661 | 700 | 1,033 | 69.9 | 47.6 |
Rental |
781 | 830 | 896 | 942 | 20.6 | 5.1 |
Financial system services |
656 | 732 | 774 | 835 | 27.3 | 7.9 |
Transportation |
867 | 832 | 776 | 642 | (26.0) | (17.3) |
Security and surveillance |
428 | 495 | 559 | 609 | 42.3 | 8.9 |
Water, electricity and gas |
254 | 225 | 237 | 345 | 35.8 | 45.6 |
Materials |
323 | 310 | 342 | 336 | 4.0 | (1.8) |
Trips |
139 | 138 | 156 | 168 | 20.9 | 7.7 |
Others |
1,401 | 793 | 760 | 867 | (38.1) | 14.1 |
| Total | 14,162 | 14,512 | 14,848 | 16,339 | 15.4 | 10.0 |
| Total personnel and administrative expenses | 26,348 | 27,573 | 28,815 | 31,038 | 17.8 | 7.7 |
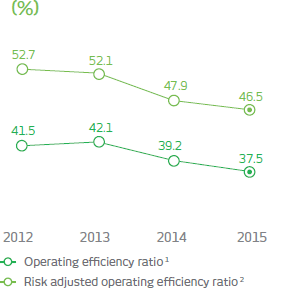
OPERATING EFFICIENCY RATIO (ER)
The Operating Efficiency Ratio (ER) ended 2015 at 37.5%, an improvement of 1.7 p.p. against 2014. This result reflects (i) the growth in financial margin and revenues from service provision and (ii) the behavior of operating expenses, which grew at a lower rate than inflation during the year, the result of ongoing efforts to control costs, including the actions of the Efficiency Committee and investments in information technology, which have been driving improvements in internal systems and processes.
These factors also helped ensure that the Operating Efficiency Ratio on a risk adjusted basis, which reflects the impact of risk associated with credit operations2, reached 46.5%, a 1.4 p.p. improvement compared with the previous year.
ER performance reflects Bradesco’s sustainable growth strategy which, among other things, included the provision of suitable products and services for clients by means of segmentation of the base, the optimization of service points and ongoing control of operating expenses.
1. ER = (personnel expenses – profit share + administrative expenses)/(financial margin + fee and commission income + insurance income + equity in the earnings of unconsolidated companies + other operating income - other operating expenses).
2. Including ALL Expenses adjusted for discounts granted, loan recovery and sale of foreclosure assets, among others.
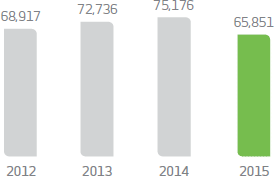
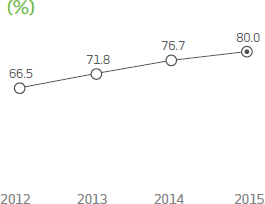
OPERATING COVERAGE RATIO
At the end of 2015, the Operating Coverage Ratio* was 80.0%, maintaining its upward trend and improving 3.3 p.p. over 2014, due mainly to the increase in fee and commission income, allied with ongoing efforts to control expenses, including the actions of the Efficiency Committee and initiatives to expand the offer of products and services to the entire client base.
*Fee and commission income/administrative and personnel expenses.
ADJUSTED BALANCE SHEET
In December 2015 adjusted total assets reached the historic mark of R$1.080 trillion, growing 4.6% compared with 2014. Shareholders’equity totaled R$88,907 million, 9.1% up on 2014.
| (R$ million) | Dec. 12 | Dec. 13 | Dec. 14 | Dec. 15 | Variation % | |
|---|---|---|---|---|---|---|
| 2015 x 2012 | 2015 x 2014 | |||||
| Assets | ||||||
| Current and long term assets | 864,279 | 892,495 | 1,016,970 | 1,059,768 | 22.6 | 4.2 |
Cash and cash equivalents |
12,077 | 12,196 | 14,646 | 17,457 | 44.5 | 19.2 |
Interbank investments |
151,813 | 135,456 | 202,412 | 140,457 | (7.5) | (30.6) |
Securities and derivative financial instruments |
315,487 | 313,327 | 346,358 | 407,584 | 29.2 | 17.7 |
Interbank and interdepartmental accounts |
49,762 | 56,995 | 52,004 | 55,728 | 12.0 | 7.2 |
Loan and leasing operations |
267,940 | 296,629 | 318,233 | 333,854 | 24.6 | 4.9 |
Allowance for loan losses (ALL)* |
(21,299) | (21,349) | (22,724) | (28,805) | 35.2 | 26.8 |
Other receivables and assets |
88,499 | 99,241 | 106,041 | 133,493 | 50.8 | 25.9 |
Permanent assets |
14,813 | 15,644 | 15,070 | 19,987 | 34.9 | 32.6 |
Investments |
1,865 | 1,830 | 1,712 | 1,587 | (14.9) | (7.3) |
Premises and leased assets |
4,678 | 4,668 | 4,887 | 5,772 | 23.4 | 18.1 |
Intangible assets |
8,270 | 9,146 | 8,471 | 12,628 | 52.7 | 49.1 |
| Total | 879,092 | 908,139 | 1,032,040 | 1,079,755 | 22.8 | 4.6 |
| Liabilities | ||||||
| Current and long term liabilities | 807,799 | 835,917 | 949,846 | 988,833 | 22.4 | 4.1 |
Deposits |
211,858 | 218,063 | 211,612 | 195,760 | (7.6) | (7.5) |
Federal funds purchased |
255,591 | 256,279 | 320,194 | 279,726 | 9.4 | (12.6) |
Funds from issuance of securities |
51,359 | 57,654 | 84,825 | 109,547 | 113.3 | 29.1 |
Interbank and interdepartmental accounts |
5,667 | 6,864 | 5,958 | 6,384 | 12.7 | 7.2 |
Borrowing and onlending |
44,187 | 56,095 | 58,998 | 70,338 | 59.2 | 19.2 |
Derivative financial instruments |
4,001 | 1,808 | 3,282 | 13,785 | 244.5 | 320.0 |
Reserves for insurance, pension plans and capitalization bonds |
124,217 | 136,229 | 153,267 | 177,835 | 43.2 | 16.0 |
Other reserve requirements |
110,919 | 102,925 | 111,710 | 135,458 | 22.1 | 21.3 |
| Deferred income | 658 | 677 | 293 | 529 | (19.6) | 80.5 |
| Non-controlling interest in subsidiaries | 588 | 605 | 393 | 1,486 | 152.7 | 278.1 |
| Shareholders’ equity | 70,047 | 70,940 | 81,508 | 88,907 | 26.9 | 9.1 |
| Total | 879,092 | 908,139 | 1,032,040 | 1,079,755 | 22.8 | 4.6 |
| *Including the allowance for sureties, in December 2015 ALL totaled R$29,499 million, classified as excessive. | ||||||
| (R$ million) | Dec. 12 | Dec. 13 | Dec. 14 | Dec. 15 |
|---|---|---|---|---|
| Opening balance | 55,582 | 70,047 | 70,940 | 81,508 |
Acquisition of treasury shares |
(14) | (72) | (29) | (133) |
Asset valuation adjustments |
6,994 | (6,969) | 563 | (3,623) |
Net profit |
11,381 | 12,011 | 15,089 | 17,190 |
Allocations: |
||||
- Interest on own shareholders’ equity paid and/or provisioned |
(3,261) | (3,224) | (3,595) | (5,123) |
- Interim Dividends paid and/or provisioned |
(634) | (854) | (1,460) | (912) |
| Final balance | 70,047 | 70,940 | 81,508 | 88,907 |
| (R$ million) | Dec. 12 | Dec. 13 | Dec. 14 | Dec. 15* | |
|---|---|---|---|---|---|
Cash flow from operational activities |
60,403 | 104,243 | 110,463 | (29,044) | |
Cash flow from investment activities |
(53,794) | (30,561) | (19,137) | (38,749) | |
Cash flow from financing activities |
4,086 | (3,412) | (4,340) | 10,400 | |
Net increase/(decrease) in cash and cash equivalents |
10,695 | 70,270 | 86,986 | (57,393) | |
| Cash and cash equivalents – beginning of period | 36,860 | 47,555 | 117,825 | 204,812 | |
| Cash and cash equivalents – end of period | 47,555 | 117,825 | 204,812 | 147,419 | |
| *For further information please refer to explanatory note 4 – Balance Sheet and Income Statement from the Financial Statements of the year ended on December 31, 2015. | |||||
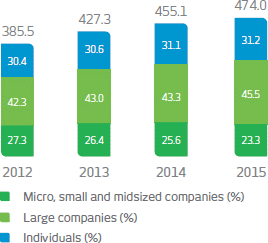
EXPANDED LOAN PORTFOLIO*
In December 2015, the Bradesco credit portfolio totaled R$474 billion, growing 4.2% compared with the previous year, as follows (i) 9.5% for large companies and (ii) 4.5% for individuals, partially offset, (iii) by the 5.3% reduction for SMEs.
The products that showed the most growth in the last 12 months for individuals were: (i) real estate financing and (ii) payroll deductible loans, mainly among the public sector and INSS beneficiaries. For corporations, the highlights were: (i) export financing and (ii) operations abroad, influenced by the exchange variation during the period.
*In addition to the credit portfolio – according to the Bacen definition – it includes sureties, guarantees, letters of credit, advances on credit card receivables, debentures, promissory notes, co-obligation in loan assignments to investment funds, real estate and agricultural credit receivables.
The highest growth rates, therefore, are related to higher risk products.
(R$ BILLION, EXCEPT WHEN OTHERWISE STATED)
| (R$ million) | Dec. 12 | Dec. 13 | Dec. 14 | Dec. 15 | Variation % | |
|---|---|---|---|---|---|---|
| 2015 x 2012 | 2015 x 2014 | |||||
| Individual | ||||||
Payroll-deductible loans |
20,757 | 26,786 | 29,619 | 34,565 | 66.5 | 16.7 |
Credit card |
20,921 | 23,915 | 26,233 | 28,592 | 36.7 | 9.0 |
Real estate financing |
10,060 | 13,602 | 17,919 | 22,781 | 126.5 | 27.1 |
CDC/vehicle leasing |
31,099 | 27,251 | 24,858 | 21,689 | (30.3) | (12.7) |
Personal loans |
15,041 | 16,476 | 16,354 | 15,201 | 1.1 | (7.1) |
Rural loans |
6,927 | 8,393 | 10,300 | 8,215 | 18.6 | (20.2) |
BNDES/Finame onlending |
5,775 | 6,803 | 7,334 | 7,029 | 21.7 | (4.2) |
Overdraft facilities |
2,989 | 3,313 | 3,666 | 3,905 | 30.6 | 6.5 |
Sureties and guarantees |
683 | 187 | 458 | 707 | 3.4 | 54.3 |
Others |
3,289 | 4,025 | 4,693 | 5,065 | 54.0 | 7.9 |
| Total | 117,540 | 130,750 | 141,432 | 147,749 | 25.7 | 4.5 |
| Corporate | ||||||
Operations abroad |
25,243 | 32,003 | 36,119 | 48,453 | 91.9 | 34.1 |
Working capital |
44,811 | 45,599 | 45,004 | 42,432 | (5.3) | (5.7) |
BNDES/Finame onlending |
29,929 | 33,740 | 34,835 | 31,129 | 4.0 | (10.6) |
Real estate financing |
12,674 | 15,870 | 23,560 | 26,508 | 109.1 | 12.5 |
Export financing |
12,023 | 15,366 | 15,839 | 23,158 | 92.6 | 46.2 |
Overdraft account |
9,793 | 10,410 | 10,462 | 9,794 | - | (6.4) |
CDC/leasing |
13,278 | 13,008 | 12,388 | 9,666 | (27.2) | (22.0) |
Rural loans |
4,653 | 5,258 | 6,657 | 5,404 | 16.1 | (18.8) |
Sureties and guarantees |
59,228 | 67,399 | 71,611 | 69,176 | 16.8 | (3.4) |
Operations bearing credit risk – commercial portfolio* |
30,874 | 33,104 | 33,185 | 34,319 | 11.2 | 3.4 |
Others |
25,484 | 24,765 | 24,035 | 26,238 | 3.0 | 9.2 |
| Total | 267,989 | 296,523 | 313,695 | 326,278 | 21.8 | 4.0 |
| *Includes debenture and promissory note operations. | ||||||
DELINQUENCY ratio > 90 DAYS*
The delinquency ratio, encompassing the balance of operations more than 90 days overdue, increased due to the slowdown in economic activity and to the lower growth of the credit portfolio. The reduction in the delinquency ratio in the large corporate segment partially offset the effects of the increase in delinquency in the individual and SME segments.
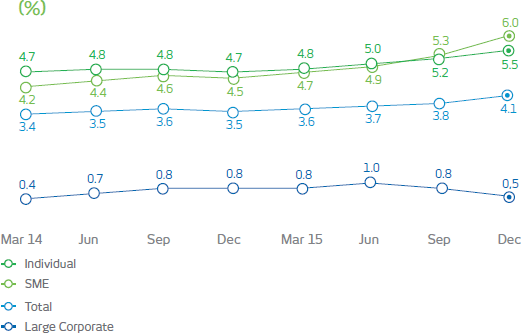
DELINQUENCY ratio FROM 15 TO 90 DAYS*
In the last quarter of 2015, short-term delinquency involving operations overdue between 15 and 90 days remained stable. The increase in the corporate segment was offset by the decease in the individual segment.
*Concept defined by Bacen.
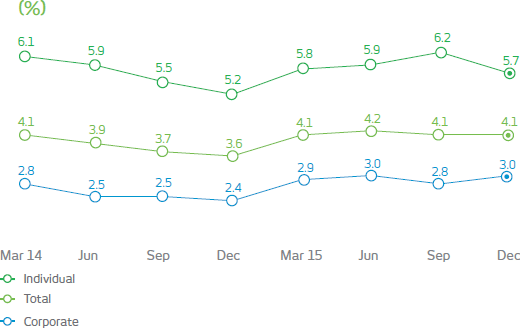
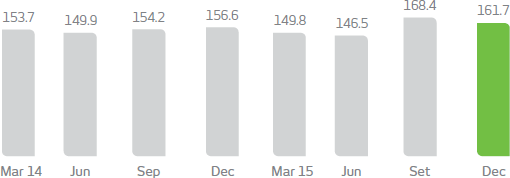
COVERAGE RATIOS ABOVE 60 AND 90 DAYS1, 2
The coverage ratio for loans more than 60 and 90 days overdue ended the year at 161.7% and 198.0% respectively, maintaining comfortable levels.
This indicator reflects the consistency and robustness of credit concession policies and processes, as well as the quality of the guarantees obtained. Bradesco has a greater coverage level than that required by regulatory bodies, helping to ensure business continuity. In addition to the allowance for loan losses required by Bacen, the Organization has a R$6.4 billion excess provision to enable it to tolerate potential situations of stress, as well as other operations/commitments involving credit risk.
COVERAGE RATES ABOVE 60 DAYS (%)
COVERAGE RATES ABOVE 90 DAYS (%)
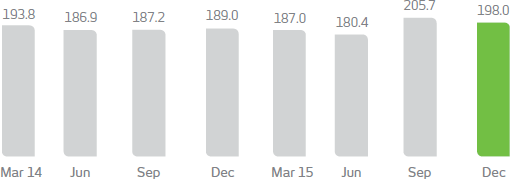
2. Includes a provision for guarantees provided, encompassing sureties, guarantees, letters of credit and standby letters of credit, in line with the concept of excess allowance for loan losses.
FUNDS RAISED AND UNDER MANAGEMENT
The funds raised and under management totaled R$1.510 trillion, an increase of R$84 million, or 5.9%, compared with December 2014. This is due mainly to the increase in (i) funds managed in domestic currency, amounting to R$61,554 million, and (ii) technical provisions for insurance, pension plans and capitalization bonds, amounting to R$24,568 million.
Bradesco presents limited dependence on interbank and external funds due to the efficiency with which it raises funds from clients in the domestic market. This efficiency is the result of (i) the exceptional positioning of its service points, (ii) the broad diversity of the products on offer and (iii) market confidence in the Bradesco brand.
| (R$ MILLION) | Dec. 12 | Dec. 13 | Dec. 14 | Dec. 15 | Variation % | |
|---|---|---|---|---|---|---|
| 2015 x 2012 | 2015 x 2014 | |||||
| Raised | 783,396 | 824,692 | 937,369 | 960,113 | 22.6 | 2.4 |
Deposits |
211,858 | 218,063 | 211,612 | 195,760 | (7.6) | (7.5) |
Securities sold under agreements to repurchase |
255,591 | 256,279 | 320,194 | 279,726 | 9.4 | (12.6) |
Funds from acceptance and issuance of securities |
47,932 | 54,592 | 82,335 | 106,275 | 121.7 | 29.1 |
Borrowing and onlending obligations |
44,187 | 56,095 | 58,998 | 70,338 | 59.2 | 19.2 |
Subordinated debt |
34,852 | 35,885 | 35,822 | 50,283 | 44.3 | 40.4 |
Securitization of future financial flows |
3,427 | 3,062 | 2,490 | 3,272 | (4.5) | 31.4 |
Own working capital/under management* |
55,822 | 55,901 | 66,831 | 70,406 | 26.1 | 5.3 |
Withholding and payment of taxes and other obligations |
439 | 815 | 435 | 601 | 36.9 | 38.2 |
Foreign exchange portfolio |
5,071 | 7,771 | 5,385 | 5,617 | 10.8 | 4.3 |
Technical reserves for insurance. pension plans and capitalization bonds |
124,217 | 136,229 | 153,267 | 177,835 | 43.2 | 16.0 |
| Managed in local currency | 441,832 | 435,364 | 488,730 | 550,284 | 24.5 | 12.6 |
| Total | 1,225,228 | 1,260,056 | 1,426,099 | 1,510,396 | 23.3 | 5.9 |
OUTLOOK FOR BRADESCO FOR 2016
The table at the side contains forward-looking statements which are subject to risks and uncertainties because they were based on the company management’s assumptions and expectations and information available in the market up until January 2016, the date on which the company’s results for 2015 were disclosed, and which may be subject to alterations during the course of 2016. For further information, refer to the Report on Economic and Financial Analysis published quarterly and available on the Bradesco Investor Relations website (www.bradesco.com.br/ir – Reports and Spreadsheets – Financial Information).
| Loan portfolio1 | 1 to 5 | ||||
Individuals |
4 to 8 | ||||
Companies |
0 to 4 | ||||
| NII – Interest-earning portion | 6 to 10 | ||||
| Fee and commission income | 7 to 11 | ||||
| Operating expenses2 | 4,5 to 8,5 | ||||
| Insurance premiums | 8 to 12 | ||||
| ALL expenses (R$ billion)3 | 16,5 to 18,5 | ||||
| 1. Expanded loan portfolio. 2. Administrative and personnel expenses. 3. Includes credit recovery revenues. |
|||||