Financial performance

After recording GDP growth of 7.5% in 2010, Brazil’s performance has been below expectations, slowing to 2.7% in 2011 and 0.9% in 2012. The slowdown experienced in 2011 was due to various negative global factors and a down- ward credit cycle. The Central Bank of Brazil reduced the Selic interest rate to a record low 7.25% in 2012, down from a peak of 12.5% in 2011. Despite sluggish economic growth, the IPCA consumer price index closed 2012 above the government’s 4.5% target at 5.84%, compared to 6.5% in 2011. In this same period electricity and oil consumption rose 6.1%.
In the second half of 2012 Brazil’s economy gained traction and the pace of annual growth rebounded to around 4.5%. Increased consumption appears to be leading the initial recovery, but the resumption of investments in infrastructure will ultimately provide greater sustainability to the growth outlook for 2013.
Inflationary pressures remain a cause for concern. At the end of 2012 the exchange rate was R$2.05 to the US dollar, compared to R$1.87 in 2011. The market consensus is that the exchange rate will remain steady between R$2.00 and R$2.10 in the medium term.
In the oil sector 2012 was marked by uncertainties and market worries, such as a slowing global economy that resulted in oil demand growth forecasts to be consistently revised downward, as well as volatility in oil price movements. The price for Brent Crude price held up and closed the year at US$111 a barrel, averaging US$112 for the period, a record price for this commodity.
| CONSOLIDATED FINANCIAL INFORMATION (IN R$ MILLIONS, UNLESS OTHERWISE INDICATED) | 2012 | 2011 | Change (%) |
|---|---|---|---|
| Net income | 82.50 | 92.10 | 10.50) |
| Depreciation and amortization | 82.90 | 53.60 | 54.70 |
| Financial Expenses/Revenues | (82.50) | 84.40) | 2.20 |
| Income tax and social contribution | 40.00 | 29.10 | 37.70 |
| EBITDA1 | 123.00 | 90.50 | 35.90 |
| Write-offs of sub-commercial and dry wells | 162.10 | 13.20 | N/A |
| EBITDAX2 | 285.10 | 103.60 | 175.10 |
| EBITDA margin3 (%) | 26.6 | 31.30 | (15.00) |
| EBITDAX margin4 (%) | 61.70 | 35.90 | 72.00 |
| Net debt5 | (952.30) | (1,098.50) | 13.30 |
| Net debt/EBITDAX (times) | (3.34) | (10.60) | 68.50 |
2. EBITDAX = EBITDA + write-down of dry or non-commercial wells.
3. EBITDA divided by net income.
4. EBITDAX divided by net income.
5. 5. Net debt includes total debt, including loans, current and long-term financing and derivatives, less cash, cash equivalents and investments. Net debt is not recognized under Accounting Practices Adopted in Brazil, IFRS, US GAAP (Generally Accepted Accounting Principles), or any other such accounting principles. Other companies may use different means to calculate net debt.
OPERATING RESULTS
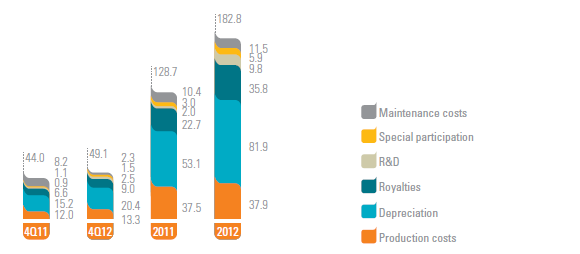
For full year 2012, net revenues were R$462.3 million, a 60.0% increase over FY11, reflecting full production capacity at the Manati Field in 2012 and strong demand from Brazil’s thermal power plants. Operating costs totaled R$182.8 million in 2012, compared to R$128.7 million in 2011.
OPERATING COSTS (IN US$ MILLIONS)
For 2012, G&A expenses were R$63.3 million, above the R$59.5 million reported in 2011. The reported amount for 2012 includes R$54.9 million in personnel expenses compared to R$43.9 million in 2011. The major part of this variation was related to the increase in personnel for operatorship at Block BS-4. On the other hand, part of these administrative expenses, R$13.1 million, was allocated to this project, where QGEP holds 30% of this amount and the remainder 70% is related to the partners of the block that reimburse expenses to the operator. The remaining R$16.4 million in G&A expenses were linked to prior and current year profit sharing costs and change in management. 2011 expenses included R$23.1 million in incentive compensation linked to the successful completion of the Company’s IPO.
Total exploration expenditures for 2012 amounted to R$177.0 million, the bulk of which was a R$125.5 million write-off for Block BM-S-12 and R$36.6 million related to the return of the Jequitibá discovery to the ANP. For full year 2012, net financial income was R$82.5 million compared to net financial income of R$84.4 million in 2011.
QGEP has a tax incentive for a partial reduc- tion in the income tax payable. An amount equal to the fiscal savings obtained must be allocated to a profit reserve account, booked under Shareholders’ Equity, and cannot be distributed as dividends to the shareholders.
Under the federal government’s Lei do Bem scheme, Queiroz Galvão Group companies also have access to tax credits by developing programs in cultural heritage conservation areas and sponsoring sports. The Company received total tax incentives of R$47.0 million in 2012, compared to R$25.1 million in 2011. GRI EC4
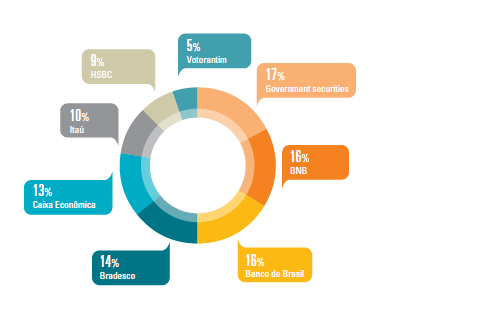
DISTRIBUTION OF INVESTMENTS
BALANCE SHEET/CASH FLOW HIGHLIGHTS
Cash is invested in dedicated funds and fixed income assets, all in reais. The cumulative average yield of the portfolio at December 31, 2012 was 101.3% of the CDI rate and approximately 96% of the funds have daily liquidity. The investment distribution is shown in the graph above.
Accounts receivable at the end of 2012 were R$92.8 million, whereas accounts payable were R$32.5 million at 2012 year end. For full year 2011, accounts receivable and payable were R$76.1 million and R$292.5 million, respectively. In the end of 2011, accounts payable included R$243.1 million related to the acquisition of 30% interest in Block BS-4.
The Company had no debt at the end of 2012. As previously reported, in the second quarter of 2012 the Company eliminated its debt, following the total repayment of the BNDES and BNB loans linked to Manati Field development. The Company had record operating cash flow of R$254.3 million for full year 2012 compared to R$194.2 million in FY11.
Further information on QGEP’s 2012 financial performance is available through the Company’s Investor Relations website at ri.qgep.com.br.
VALUE-ADDED STATEMENT
GRI EC1
| ITEM | DESCRIPTION | 2012 | 2011 |
|---|---|---|---|
| Revenue | Net sales plus revenue from financial investments and disposal of assets. | 691,534 | 898,777 |
| Wealth distribution | |||
| Operating expenses | Payments to suppliers and non-strategic investments. | 365,257 | 669,472 |
| Salaries and employee benefits | Total payroll. | 41,377 | 33,478 |
| Government | Gross tax. | 200,467 | 131,290 |
| Payments to capital providers of capital (ex. shareholders) | - | - | |
| Community investments | Voluntary contributions plus investments in the entire community, including donations. | - | 11,889 |
| Accumulated wealth (wealth produced less wealth distributed) | Investments and financings | - | - |
| 1 – Revenue | Sum of items 1.1 to 1.3 | 691,534 | 898,777 |
| 1.1) Sales of goods, products and services Includes ICMS (goods and services circulation tax) and IPI (excise tax on indus- trialized products) on gross revenue or gross sales. | 586,833 | 372,403 | |
| 1.2) Provision for doubtful debts - Reversal/Constitution | Constitution/write-down of provision for doubtful debts. | - | - |
| 1.3) Non-operating | Includes values not considered part of the company’s primary activities, such as earnings or losses on the write-down of assets, and gains or losses on the write-down of investments. |
104,702 | 526,374 |
| 2 – Inputs acquired from third parties (including ICMS and IPI) | Sum of items 2.1 to 2.4 | 365,257 | 669,472 |
| 2.1) Raw materials consumed | Included in the cost of goods sold. | - | - |
| 2.2) Cost of goods and services sold | Not including expenses on own personnel. | 228,475 | 100,991 |
| 2.3) Materials, energy, outsourced services | Acquisitions and payments to third parties. For cost of goods, materials and services sold, and energy consumed, ICMS and IPI is included at time of purchase, whether recoverable or not. | 120,597 | 561,300 |
| 2.4) Loss/Recovery of assets | Market value of inventory and investments. | 16,186 | 7,181 |
| 3 – Gross added value | Difference between items 1 and 2 (1-2) | 326,276 | 229,305 |
| 4 – Deductions | Item 4.1 | 82,919 | 53,606 |
| 4.1) Depreciation, amortization and depletion | Expenses recorded in the period. | 82,919 | 53,606 |
| 5 – Value-added produced by the company | Difference between items 3 and 4 (3-4) | 243,357 | 175,699 |
| 6 – Value-added received in transfer | Sum of items 6.1 and 6.2 | 110,721 | 153,276 |
| 6.1) Equity accounting result | Includes amounts received as dividends on investments, valued at cost. | - | - |
| 6.2) Revenues | Includes all revenues, regardless of origin. | 110,721 | 153,276 |
| 7 – Total value added for distribution | Sum of items 5 and 6 (5+6) | 354,079 | 328,975 |
| 8 – Value-added distributed | Sum of items 8.1 to 8.5 | 354,079 | 328,975 |
| 8.1) Personnel and charges | Holiday and year-end bonus pay, FGTS pension, food, transportation. | 41,377 | 33,478 |
| 8.2) Taxes, charges and contributions | Includes INSS (social security) contributions, income tax, social contribution and all other taxes. |
200,467 | 131,290 |
| 8.3) Interest and rent | Expenses and interest on loans and financings. | 29,767 | 72,070 |
| 8.4) Interest on capital and dividends | Amounts paid or credited to shareholders. | - | - |
| 8.5) Retained profit/loss for the year | Includes profits allocated to profit reserve. | 82,468 | 92,137 |
The main year-on-year changes in the Value-Added Statement are due to two factors. Firstly, the Company increased the number of employees in preparation for future operations in Block BS-4. Secondly, production at the Manati Field generated higher income, and consequently the Company paid a higher amount of taxes.
CAPITAL MARKETS
Representing a market value of R$3.5 billion, QGEP’s stock price (Ticker: QGEP3) was R$13.12 at the end of 2012, down 20.5% from December 31, 2011. Nonetheless, QGEP was the best performing oil and gas stock listed on the Bovespa based on price performance in the second half of 2012, with an average financial volume of R$9.3 million and an average daily volume of approximately 1,700 trades.
In January 2012, the Company was also selected for inclusion in the Brazil Index (IBrX), which tracks the BM&FBovespa’s Top 100 companies in terms of negotiability. During the year, the support of the Company’s stock was further espoused by the addition of one sell-side analyst, amounting to 16 sell-side analysts that cover QGEP, representing both domestic and international banks and brokerages. At the end of 2012, 13 of the analysts had BUY recommendations and three had NEUTRAL recommendations on the Company. The stock’s average target price was R$17.40.
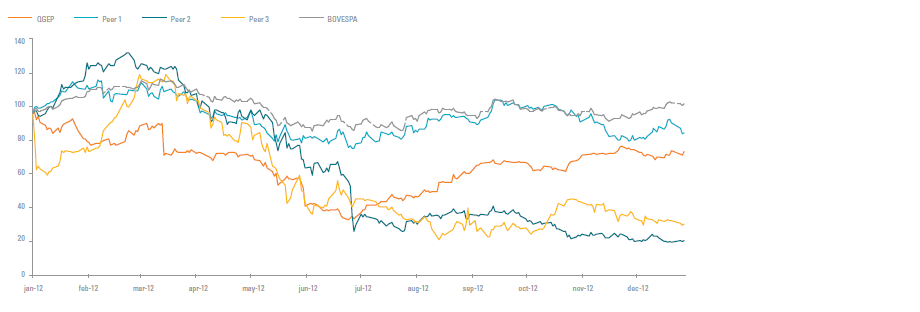
During 1H12, exploratory drilling at the Ilha do Macuco well (BM-S-12) did not find any potentially productive zones, which affected QGEP’s asset portfolio. This change was reflected on the share price performance in the period. On the other hand, in 2H12, the Carcará discovery (BS-8) and the performance of the Manati Field drove the share price up at a faster pace than its main peers.
The payment of dividends to shareholders is enshrined in QGEP’s Bylaws and the provisions of the Corporations Act. To help ensure the Company’s financial sustainability, dividend payments can only occur after the financial reserves reach 20% of the Company’s share capital. As QGEP is in an investment phase, most of its profits are reinvested in its business, which minimizes the amount allocated to dividends. Company management proposed allocating R$783.45 in mandatory dividends, which represents 0.001% of adjusted net profit after allocation to the Legal Reserve, or R$0.000003 per common share.
SHARE PRICE PERFORMANCE: QGEP AND PEERS, 2012