
Home > Economic and Financial Performance > Net Revenue
Net
Revenue
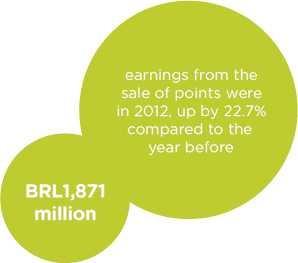
Higher net revenue from one year to the next was mostly due to revenue from redemption of points, which was 38.8% higher.
| Composition of net revenue (BRL thousands) | 2012 |
2011 |
2010 |
|---|---|---|---|
From redemption of points |
1,425,055 |
1,026,456 |
469,843 |
Hedge for revenue from points |
(14,433) |
9,740 |
N/A |
Breakage |
214,254 |
318,743 |
122,645 |
Other revenue |
3,236 |
18,506 |
12,960 |
Gross revenue |
1,628,143 |
1,373,447 |
517,875 |
Taxes and other deductions |
(152,129) |
(126,634) |
(48,032) |
Net revenue |
1,476,014 |
1,246,812 |
469,843 |