TRACTEBEL ENERGIA PERFORMANCE
Operating performance
Uptime
In 2014, the annual uptime achieved by the plants operated by Tractebel Energia was 96.5%, disregarding scheduled stoppages — broken down into 98.7% for hydroelectric plants, 83.3% for thermoelectric plants, and 95% for complementary sources. Including scheduled stoppages, overall uptime was 86.8%, broken down into 88.9% for hydroelectric plants, 71.9% for thermoelectric plants, and 89.3% for complementary sources. GRI EU30
Production
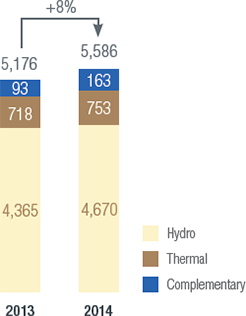
In the 12-month period, total electric energy output reached 48,941 GWh (5,586 average MW), an increase of 7.9% in relation to 2013. Of the total generated, the hydro plants were responsible for 40,912 GWh (4,670 average MW), a 7.0% increase; thermoelectric plants for 6,598 GWh (753 average MW), an increase of 4.8%; and the complementary plants for 1,432 GWh (163 average MW), an increase of 76.5% also related to 2013. The increase in the complementary-fired plants was due to the startup in operations of Fleixeiras I and Mundaú wind farms, the Ferrari TPP and the Cidade Azul Solar Plant in 2014.
It is worth noting that the increase in hydroelectric generation does not necessarily result in an improvement or deterioration in the Company’s economic and financial performance. In the same way, the reduction in this type of generation does not of itself imply deterioration in economic-financial performance. This is due to the use of the Energy Reallocation Mechanism (MRE), which dilutes the risks of hydroelectric generation among all the Mechanism’s participants. The increase in the Company’s thermal generation mitigates exposure to the spot Price for Settlement of Differences (PLD), the opposite also being true, all other variables remaining unchanged.
Clients
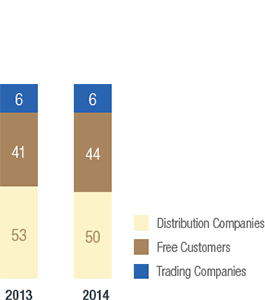
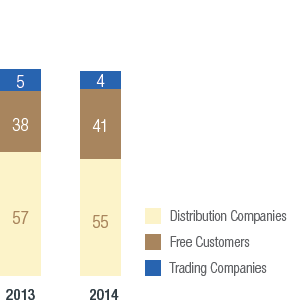
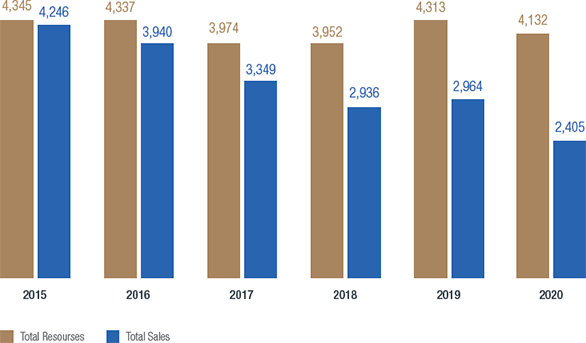
In 2014, free consumers represented 44.0% of physical sales and 40.6% of net revenue from contracted sales, increases of 2.6 p.p. for both indicators compared with 2013.
Generation (Average MW)
Breakdown of Customers by Physical Sales (%)
Breakdown of Customers in Contracted Sales Comprising Net Revenues from Sales (%)
Sales Strategy
The Company pursues a commercial strategy of gradual sales of future energy availability for any given year as a means of offsetting the risk of exposure to spot prices (Price for Settlement of Differences – PLD) for that particular year. Electric energy sales are made during windows of opportunity which open when the market shows a greater buying propensity. However, Tractebel Energia is considering leaving a larger volume of its commercial capacity uncontracted in the short-term market to attenuate the impact of some negative factors prevailing in the current scenario. These include the changes in spot price calculation methodology considerably increasing it and the greater volatility of this price, combined with the systemic deficit in hydroelectric generation in recent quarters and the outlook that this situation will persist.
Energy balance
According to data on our own commercial capacity and purchase contracts in effect as at December 31, 2014, Tractebel Energia's energy balance is as follows:
Energy balance (avg MW)
Economic and financial performance GRI G4-EC1
Financial indicators and information
| 2014 | 2013 | 2012 | Change | |
|---|---|---|---|---|
| Financial information (R$ million) | ||||
| Total assets | 13,620.5 | 12,637.6 | 12,310.95 | 7.8% |
| Shareholders’ equity | 5,654.9 | 5,364.6 | 5,502.35 | 5.4% |
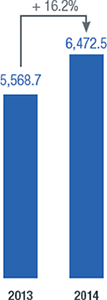
| Net sales revenue | 6,472.5 | 5,568.7 | 4,912.5 | 16.2% |
| Gross profit | 2,497.7 | 2,657.0 | 2,781.6 | -6.0% |
| Earnings from services (EBIT)(1) | 2,302.9 | 2,387.2 | 2,539.35 | -3.5% |
| Operating income | 1,956.6 | 2,001.7 | 2,086.35 | -2.3% |
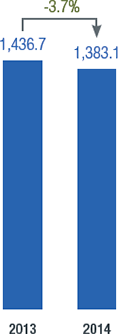
| Net income | 1,383.1 | 1,436.7 | 1,490.95 | -3.7% |
| EBITDA(2) | 2,895.1 | 3,042.6 | 3,100.55 | -4.8% |
| Financial indicators (R$ million) | ||||
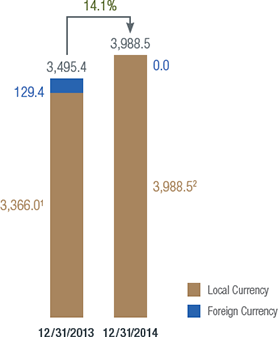
| Total debt (borrowings and debentures) | 3,988.5 | 3,495.4 | 3,534.5 | 14.1% |
| Cash and cash and equivalents and restricted deposits | 1,750.7 | 1,346.1 | 1,283.2 | 30.1% |
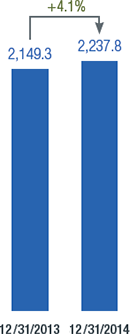
| Net debt | 2,237.8 | 2,149.3 | 2,251.3 | 4.1% |
| ROCE(3) (%) | 22.3 | 23.1 | 24.75 | -0.8 p.p. |
| Gross debt/EBITDA | 1.4 | 1.1 | 1.1 | 0.3 p.p. |
| Net debt/EBITDA | 0.8 | 0.7 | 0.7 | |
| Debt-to-equity ratio (%) | 58.5 | 57.6 | 55.35 | 0.9 p.p. |
| Operating margin (%) | 30.2 | 35.9 | 42.55 | -5.7 p.p. |
| Net margin (%) | 21.4 | 25.8 | 30.35 | -4.4 p.p. |
| Shares | ||||
| Net earnings per share (R$) | 2.1189 | 2.2011 | 2.28405 | -3.7% |
| Average share price(4) – common (R$) | 32.97 | 33.11 | 28.77 | -0.4% |
| Dividends per share (R$) | 1.1876 | 2.2584 | 2.3691 | -47.4% |
Net revenue from sales
a) Net revenue from sales
Full year-on-year comparison shows an increase in net revenue from sales of R$903.8 million, or 16.2%, rising from R$5,568.7 million in 2013 to R$6,472.5 million in 2014. This rise is essentially due to the following combination of factors:
- R$351.4 million – increase in net average sales price;
- R$218.4 million – increase in average volume of energy sold;
- R$176.8 million – increase in revenue from transactions conducted in the spot market, including in the Electric Energy Trading Chamber (CCEE);
- R$159.9 million – rearrangement of the revenue that the Company did not receive in the CCEE due to the temporary downtime of generation caused by accidents in the Jorge Lacerda Thermoelectric Complex; and
- R$6.1 million – decrease in revenue from sale of carbon credits.
b) Net average selling price
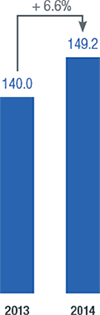
The average selling price of energy for 2014, net of income tax was R$149.20/MWh, 6.6% greater than the case in 2013, when the price was R$139.97/MWh. The price increase was largely the result of the monetary restatement of existing contracts.
c) Sales volume
The amount of energy sold in 2014 was 37,072 GWh (4,232 average MW), against 35,445 GWh (4,046 average MW) in 2013, a growth of 1,627 GWh (186 average MW), or 4.6%.
Comments on variation in net revenue from sales, by client class
a) Distributors
Revenue from sales to distribution companies in 2014 reached R$3,044.0 million, an increase of 7.8% compared with fiscal year 2013, which reported R$2,824.2 million in revenue from sales to distributors. This increase is explained by the association of the following variations: (i) R$216.1 million – growth of 7.6% in the average net selling price; and (ii) R$3.7 million – a slight increase of 0.1% in energy volume sold.
b) Trading Companies
Revenue from sales to trading companies was R$239.2 million, 4.4% lower than revenue reported in 2013 of R$250.1 million. The reduction is the result of the following aspects: (i) R$7.6 million – reduction of 3.1%, or 65 GWh (7 average MW) in the amount of energy sold; and (ii) R$3.3 million – decrease of 1.3% in the net average selling price.c) Free consumers
In 2014, revenue from sales to free consumers reached R$2,247.9 million, 19.1% up from the R$1,887.0 million recorded for 2013. This expansion is related to the following: (i) R$222.3 million – growth of 1,669 GWh (191 average MW), or 11.4%, in the volume of energy sales; and (ii) R$138.6 million – growth of 6.9% in the net average selling price.
d) Transactions in the short term market, including those conducted through the CCEE
Year-on-year there was an R$336.7 million growth in the revenue from spot market transactions, including those conducted through the CCEE, from R$566.4 million in 2013 to R$903.1 million in 2014. The amount recorded for the past twelve months of 2014 include the recognition of the recomposition of revenue shortfall due to the reduction in the long position on the CCEE, on grounds of temporary interruption of generation, motivated by insurance claims incurred in Jorge Lacerda Thermoelectric Complex’s generator units, in the amount of R$159.9 million. A more detailed explanation as to these operations and variations is to be found in the item below “Details of short-term operations including transactions conducted on the CCEE”.
Net revenue from sales (R$ million)
Net average selling price* (R$/MWh)
Costs of electric energy and services
In 2014, costs of energy sold and services provided reached R$3,974.8 million, 36.5%, or up R$1,063.1 million from R$2,911.7 million in 2013. This growth is essentially due to:
- Electric energy purchased for resale: increase of R$500.5 million in 2014 compared to 2013, reflecting mainly (i) pricing adjustments of existing contracts; and (ii) the increase of mediumand long-term power purchasing agreements of 2,897 GWh (331 average MW) in 2014.
- Transactions in the short term market, including those conducted through the CCEE: year-on-year costs grew R$401.6 million. Such changes includes R$83.3 million recognized as cost recovery due to the increase of our exposure to the CCEE as a result of the temporary shutdown of Jorge Lacerda Thermoelectric Complex, previously mentioned. Greater details are described in the specific item below.
- Fuels for electric energy production: year-on-year increase of R$134.1 million, reflecting principally the increase in natural gas consumption at the William Arjona Thermoelectric Power Plant in the light of the greater deployment of this facility.
- Charges for the use of and connection to the electricity grid: year-on-year increase of R$25.1 million largely reflecting the annual readjustment in transmission tariffs as well as the entry into commercial operation of the Trairi Wind Farm Complex and the acquisition of Ferrari Termoelétrica S.A.
- Materials and third party services: year-on-year growth of R$20.7 million due principally to greater demand for operating and maintenance services particularly at the Jorge Lacerda Thermoelectric Complex, the São Salvador Hydro Power Plant and Ferrari Thermal Power Plant. Financial compensation for use of water resources (royalties): year-on-year increase of R$22.4 million, basically due to the increase in generation at the Company’s hydroelectric units.
- Financial compensation for the use of water resources (royalties): increase of R$22.4 million when comparing the full years 2014 and 2013, due to the increase in generation from the Company’s hydroelectric plants.
- Personnel: year-on-year increase of R$16.1 million largely due to the annual wage bargaining agreement on salaries and benefits for employees.
- Depreciation and amortization: year-on-year increase of R$9.7 million mainly due to the start of the Wind Farm Complex operations and the acquisition of Ferrari Termoelétrica S.A.
- Reversal of operating provisions, net: year-on-year positive impact on net income of R$13.8 million mainly due to: (i) R$92.3 million – reversal of the civil provision for collecting an additional amount on the Tariff for the Use of the Transmission System (TUST) from Ponte de Pedra Hydroelectric Power Plant (UHPP), due to a ruling in favor of the Company which reduced the risk of loss from the outcome of the legal action; (ii) R$89.3 million – civil provisioning due to a judicial dispute with a supplier in the light of a disagreement over the implementation of the current legislation establishing the price of raw materials used by the Company; and (iii) R$15.7 million – reversal of a provision on a social security service (INSS) collection as a result of the Company’s adherence to the amnesty on tax liabilities under the so-called “REFIS da Copa” program.
- Other: year-on-year positive impact of R$55.4 million basically reflecting the reversal, in the second quarter of 2014, of expired liabilities related to energy purchased and transmission charges totaling R$54.8 million.

Details on transactions in the spot market, including those conducted through the CCEE
Short-term operations are classified as energy purchase or sale operations not exceeding six months and having the optimization of Tractebel Energia's exposure to the CCEE as their prime objective. Consequently, the price of these operations is characterized by the linkage with Price for Settlement of Differences (PLD) or spot price. This item also includes the transactions conducted through the CCEE, given the volatile and seasonal nature – and, therefore, short-term transactions – of the results originated from accounting in CCEE. Additionally, the long and short positions are settled at the spot price, thus, similar to the short-term operations described above.
As to the transactions conducted through the CCEE, the various monthly credit or debit entries to the account of an agent are summarized in a single billing as a receivable or a payable. This therefore requires an entry to either an income or an expenses account. In this context, it is worth pointing out that due to adaptations to the Company’s portfolio management strategy, changes have been taking place in the billing profile in the past few years. Such fluctuations complicate the direct comparison of the elements comprising each billing in the two years – the reason for including this specific topic, allowing to analyze the oscillations of the principal elements involved in spite of allocation being either to income or expenses according to the credit or debit nature of the billing to which they relate.
Generically speaking, these elements are income or expense items arising for example from:
- the application of the Energy Reallocation Mechanism (MRE);
- the Assured Energy Adjustment Factor which occurs when the generation from the plants which are part of the MRE, in relation to allocated energy, is greater (Secondary Energy) or less (Generation Scaling Factor – GSF);
- the so-called “sub-market risk”;
- dispatch triggered by the Risk Aversion Curve (CAR);
- the application of System Service Charges (ESS), resulting in dispatch which diverges from the thermal plants order of merit; and
- naturally, exposure (a short or long position in the monthly accounting) which will be settled at the spot price.
For full-year 2014, the net result of transactions in the spot market, including those conducted through the CCEE, was negative R$136.2 million, compared to the negative result of R$71.3 million obtained in 2013, i.e., there was a year-on-year decrease of R$64.9 million. By deducting the recognition of the National Energy Policy Council (CNPE 03) provision in 2013 and its reversal in 2014, the year-on-year negative result of transactions in the spot market, including those conducted through the CCEE, would increase by R$173.9 million.
This decrease is largely due to a combination of the following elements:
- growth of the negative net impact resulting from applying the GSF;
- increase in the long position on the CCEE reflecting the Company’s strategy for monthly allotments of energy;
- increase in thermoelectric exposure due to the stoppage of generation for maintenance to the generator unit at the Jorge Lacerda Thermoelectric Plant;
- decrease in spot market energy purchases;
- increase of the positive result in the MRE;
- reversal of provision for contingent costs related to the impacts related to generation companies’ sharing of System Service Charges (ESS), established by Resolution CNPE 03, since the risk of an unfavorable outcome in the lawsuit challenging the collection of these amounts; and
- recovery of the negative effects in the CCEE arising from generation downtimes due to accidents in generation units, previously mentioned, and thus the negative effects reported in items (i) and (iii) above were offset by the other elements.
It is worth pointing out that the year-on-year significant increases in the average PLD, reported below, notably contributed to the positive effects on results arising from the increased long position on the CCEE and negatively, in the form of costs relative to the application of the GSF and to thermoelectric exposure. Year-on-year, the PLD for the South and Southeast/Central-West submarkets increased 161.7%, from R$258.19/MWh in 2013 to R$675.81/MWh in 2014.
Provision for reduction in impairment value
In 2013, the Company recognized a provision for a reduction of impairment value on assets, especially those of the Charqueadas Thermoelectric Power Plant, of R$72.8 million. The impairment value of Charqueadas assets was constituted due to the probable effects resulting from the rules imposed by Aneel reducing the reimbursement for coal consumption as from January 2016. Based on internal assessments, these rules would result in an impairment loss on assets and not permit a return on the additional investments needed to meet the Regulator’s new efficiency parameters at the plant.
EBITDA AND EBITDA MARGIN
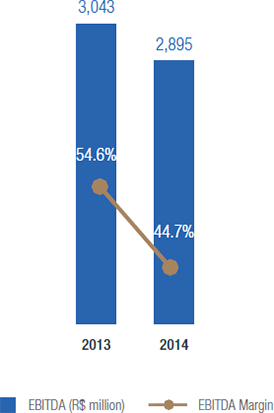
In full-year 2014, EBITDA posted a reduction of R$147.5 million, or 4.8%, from R$3,042.6 million in 2013 to R$2,895.1 million in 2014. The EBITDA margin in 2014 was 44.7%, representing a decline of 9.9 p.p. compared with 2013. This decline can be largely attributed to a combination of the following factors:
- R$569.8 million increase in net revenue from contracted energy sales;
- R$417.1 million negative effect of transactions in the spot market, including those across the CCEE;
- recognition in 2014 of the recovery of the negative effects on the CCEE due to the aforementioned stoppages at the Company’s generator units in the amount of R$243.2 million;
- reversal in 2014 of the provision recognized in 2013 for impacts of CNPE Resolution 03, amounting to R$54.5 million, resulting in positive variation of R$109.0 million;
- growth of R$500.5 million in energy purchases for resale;
- growth of R$134.1 million in fuel consumption;
- constitution in 2014 of a provision of R$89.3 million in the light of a judicial dispute with a supplier following a disagreement on the price of fuel consumption;
- reversal in 2014 of provisions with respect to: (viii.i) collection of an additional amount on the Tariff for Use of the Transmission System from Ponte de Pedra Hydroelectric Power Plant of R$92.3 million; and (viii.ii) prescribed liabilities of R$54.8 million; and
- an increase of R$75.6 million of the remaing operating costs and expenses. Excluding the non-recurring effects mentioned in items (iv), (viii.i) and (viii.ii), EBITDA would have reached R$2,693.5 million and R$3,097.1 million, for the years 2014 and 2013, respectively, a reduction of R$403.6 million, or 13.0%, between the compared fiscal years.
EBITDA1 (R$ million) and EBITDA Margin
Reconciliation of net income with EBITDA (In millions of R$)
| 2014 | 2013 | Change (%) | |
|---|---|---|---|
| Net income | 1,383.1 | 1,436.7 | -3.7 |
| (+) Income tax and social contribution | 573.5 | 565.0 | 1.5 |
| (+) Financial expenses, net | 346.3 | 385.5 | -10.2 |
| (+) Depreciation and amortization | 592.1 | 582.5 | 1.7 |
| (+) Provision for impairment | 0.0 | 72.8 | -100.0 |
| EBITDA | 2,895.0 | 3,042.5 | -4.8 |
Financial revenues increased R$ 23.7 million, from R$ 182.7 million to R$ 206.4 million
Finance results
a) Financial income
Year-on-year financial income increased R$23.7 million, from R$182.7 million in 2013 to R$206.4 million in 2014. This variation is explained essentially by the following factors:
- reversal of R$61.4 million in 2014, corresponding to interest and monetary restatement on prescribed liabilities mentioned under the item “Cost of Electric Energy Sales and Services – Others”;
- increase of R$25.4 million in revenue on financial investments;
- reduction of R$18.0 million in gains as a result of favorable rulings on law suits;
- recognition of a gain of R$49.1 million in 2013 resulting from the early settlement at market value of debt with the Federal Treasury Department (STN); and
- an increase of R$2.0 million in monetary restatement of court escrow deposits.
b) Financial expenses
Financial expenses dropped from R$568.2 million in 2013 to R$552.7 million in 2014, a difference of R$15.5 million. This was the result of a combination of the following variations:
- a reduction of R$42.4 million in expenses with the translation effect on currency denominated debt;
- an increase of R$7.9 million on interest and monetary restatement on concessions payable;
- an increase of R$7.3 million in net interest on actuarial liabilities;
- growth of R$6.8 million in interest and monetary restatement on debt; and
- an increase of R$4.9 million in financial charges on other Company debts.
Income Tax and Social Contribution on Net Income
Income tax and social contribution expenses increased from R$565.0 million in 2013 to R$573.5 million in 2014, an R$8.5 million growth. This variation also reflects the result above all of the combination between the reduction in pre-tax profit and the lower value credit value of interest on shareholders’ equity. The effective tax rates on profits for 2014 and 2013 were 29.3% and 28.2%, respectively.
Net income
Net income decreased from R$1,436.7 million in 2013 to R$1,383.1 million in 2014, a reduction of R$53.6 million, or 3.7%. This variation stems essentially from the following factors already explained above, net of income tax and social contribution:
- reduction of R$97.4 million in EBITDA;
- decline of R$37.1 million in net recurring financial expenses and reduction of non-recurring financial gains between 2013 and 2014 of R$11.2 million, resulting in a variation of R$25.9 million in the financial result;
- an increase of R$6.4 million in depreciation and amortization;
- recognition of R$48.0 million in impairment value in fiscal year 2013; and
- a decrease of R$23.7 million in the permanent deductions on the basis of calculation on income tax and social contribution, in particular in the interest on the shareholders’ equity.
Disregarding annual nonrecurring effects, net of tax, positively impacting EBITDA for 2014 in the total amount of R$133.1 million and negatively in 2013 for R$36.0 million, registered impairment value in 2013 of R$48.0 million and the positive nonrecurring effects on the financial result, namely; (I) financial charges of R$40.5 million on reversal of prescribed liabilities in 2014; (ii) gain in 2013 of R$32.4 million in the early settlement of debt; and (iii) a gain in 2013 of R$19.3 million in a lawsuit with no right of appeal, net income in 2014 and 2013 would have been R$1,209.5 million and R$1,469.0 million, respectively, a year-on-year reduction of 17.7% or R$259.5 million.
Net Income
R$ million
Evolution of Net Debt
R$ million
Debt
As at December 31, 2014, the Company’s net debt (total debt less cash and cash equivalents) was R$2,237.8 million, a 4.1% increase compared to the debt recognized at the end of 2013. Beginning in the third quarter of 2014, the restricted deposits aimed at guaranteeing the payment of the debt services started to be deducted by our gross debt for net debt calculation purposes. In order to maintain consistency of procedures between the periods analyzed, net debt as of December 31, 2013 was adjusted from R$2,271.2 million to
Total consolidated gross debt, represented largely by loans, financing and debentures, net of hedge operations, totaled R$3,988.5 million at the end of 2014, an increase of 14.1% compared to the position of December 31, 2013. Out of total debt at the end of the period, 28.7% was denominated in foreign currency (9.7% at the end of 2013). However, taking into account the swap operations, the Company recorded no currency exposure at the end of 2014.
Composition of Total Debt (R$ million)
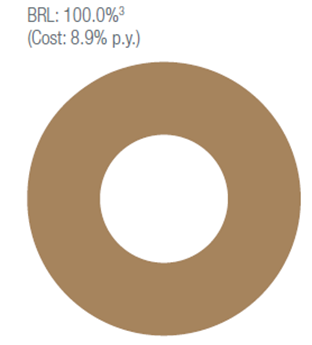
Cost of Debt
1 Includes debt of US$ 90.0 million, with full swap to CDI.
2 Includes debt of US$ 370.3 million, with full swap to CDI.
3 Includes debt of US$ 460.3 million, with full swap to CDI.
The increase in Company debt is largely related to a combination of the following factors occurring between 2013 and 2014:
- drawdown from the BNDES and its financial agents of the total amount of R$130.7 million in support of investment driven to the modernization of the Salto Santiago and Passo Fundo HPP;
- absorption of the financing contract with the BNDES and on lending banks due to the acquisition of the Ferrari Termoelétrica S.A. for R$44.5 million;
- contracting of loans in foreign banks for US$ 370.3 million (equivalent to R$927.2 million), subject to swap operations to protect the entirety of future cash flows against US dollar appreciation;
- issue in December 2014 of simple non-convertible debentures for R$162.4 million;
- the generation of R$265.3 million in incurred charges payable including monetary restatement and currency translation effects;
- amortization of debentures of R$184.6 million; and
- R$852.3 million in amortization of loans and financing.
Maturity Term Loans (R$ million)
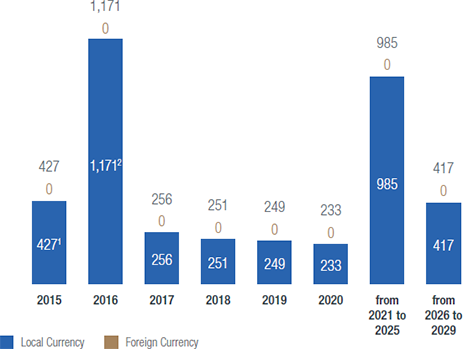
2 Includes debt of US$ 370.3 million, with full swap to CDI.

During the year, Tractebel Energia's investments in environmental management totaled R$17.0 million, while operating expenses totaled R$32.1 million
Cost of capital
The usual formation of the capital invested by Tractebel Energia in expanding its business is one third equity — for this, we retain part of the earnings generated, when necessary — and two thirds debt. In respect of the debt portion, we have obtained financing by means of sector-specific lines of credit, preferentially from the BNDES, with below-market interest rates. A majority of these resources are linked to the TJLP rate (61.9% of total debt in local currency as at December 31, 2014). The remainder of the resources are from other loans with variable rates in the market. In the year ended December 31, 2014, our total cost of debt was 8.85%, fully denominated in local currency. The cost of equity is presumably greater than the cost of debt and, in the Company’s case, takes into account the risk-free rate, the Brazil risk rate and the market risk premium, as well as the unlevered beta, which varies according to the market, the historical series for the share price and stock market liquidity. Considering the requirement of an adequate rate of return, the Company seeks to satisfactorily remunerate investments made with equity.
Investments in 2014
Expansion and refurbishment of generation facilities
In 2014 we carried out the expansion and refurbishment of our generation facilities. The construction of the Trairi, Campo Largo and Santa Mônica wind farm complexes and the expansion of the Ferrari Thermoelectric Plant demanded investments totaling R$343.0 million. We also invested R$228.4 million in maintenance and refurbishment projects. Thus, in 2014 these investments totaled R$571.4 million.
Research and Development (R&D)
We invested R$40.5 million in our R&D program: R$16.2 million in projects, and we transferred the same amount to the National Fund for Scientific and Technological Development, and R$8.1 million to the Ministry of Mines and Energy. The total investment in more than 25 projects in progress — some in association with other entities — amounts to approximately R$142 million. GRI EU8
Environmental management
Our investment totaled R$17.0 million, while operating expenses totaled R$32.1 million. GRI G4-EN31
Professional development
Our training and development plan covers our short-, medium- and long-term strategies. In 2014, R$5.2 million was invested in training, courses and lectures aimed at developing, updating and qualifying our employees, with a recorded average of 66.5 training hours per employee and a total of 75,386 hours, of which 46,564 was in technical courses, 13,162 was in Occupational Health and Safety (OHS), 6,016 was in languages, and 9,644 was in areas such as behavior, leadership, and communication.
Ethics-related aspects — such as fighting corruption and respect for diversity and human rights — were part of our Induction Program for new employees. Additionally, these issues are addressed in events such as seminars, open to the general public. GRI G4-HR2
The training programs held in 2014 that included issues related to anticorruption policies and procedures included the ones listed in the table below. GRI G4-SO4
Training about Ethics GRI G4-LA9
| Subject | No. of participants |
|---|---|
| Tractebel Energia Ethical Values | 39 (new employees) |
| Ethical, operating and control aspects included in the Anti-Corruption Law | One (internal audit manager) |
| Small gifts and amenities | 393 (managers and officers) |
| III Ethics, Sustainability and Energy Seminar | 237 (employees and general public) |
| Lecture “The power of ethics in today’s Brazil” | 66 (employees) |
| Anti-Corruption Law | 481 (employees, officers, and Directors) |
| Total | 1,217 |
Average number of hours of training per year and per employee, divided per gender and position
GRI G4-LA9
| Hours of Training per Gender | Men | Women | Total |
|---|---|---|---|
| Hours | 66,596 | 8,790 | 75,386 |
| Hours/employee | 69.1 | 51.4 | 66.5 |
Hours of training per position GRI G4-LA9
| Position | Total | Average |
|---|---|---|
| Management | 18,870 | 153.4 |
| Analysts, Engineers and Specialists | 20,562 | 51.1 |
| Operators, Maintenance Technicians and Administration | 35,954 | 59.0 |
Corporate Social Responsibility (CSR)
The list below shows Tractebel Energia’s investment in CSR through resources with and without tax incentives in 2014.
- R$4.1 million in investments not entitled to tax incentives;
- R$1.8 million in investments through the Childhood and Adolescence Fund;
- R$9.4 million in investments under the Cultural Incentive Act;
- R$1.3 million in investments under the Incentive to Sports Act; and
- R$1.2 million in other investments entitled to tax incentives (health and other areas).
Additional dividends proposed
Our Board of Directors approved, at the meeting held on March 30, 2015, a proposal for additional dividends for the period January 1 to December 31, 2014, totaling R$172.1 million (R$0.2636276932 per share), which should be ratified at the Annual Shareholders’ Meeting, where payment terms will be decided.
Thus, in 2014, total payout will be R$775.2 million, equivalent to R$1.1875973571 per share or 55% of the distributable adjusted net income.
Capital market and share performance
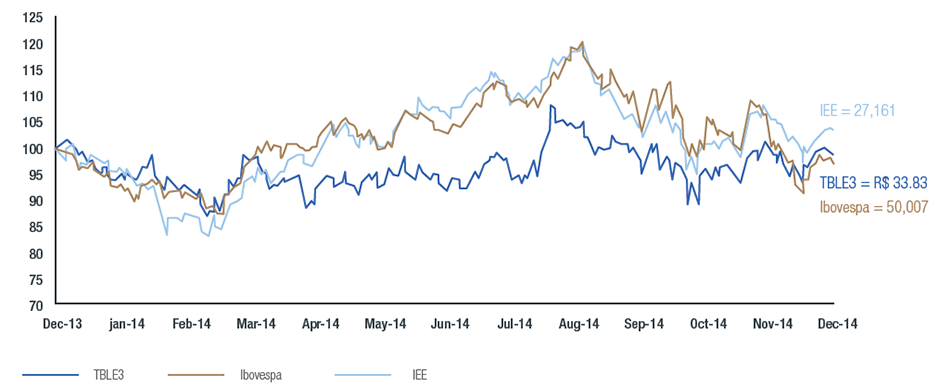
Since joining BM&FBovespa’s Novo Mercado, Tractebel Energia has been part of the Special Corporate Governance Stock Index (IGC) and the Special Tag-Along Rights Stock Index (ITAG), which bring together those companies that offer their minority shareholders a greater than usual level of protection in the event of a sale of control. Its shares are also part of BM&FBovespa’s Corporate Sustainability Index (ISE), attesting our commitment to corporate responsibility, and the Electric Utilities Index (IEE), which is a sector-specific index formed by the electric energy sector’s most important publicly-traded companies. On January 6, 2014, our shares became part of BM&FBovespa’s main index, the Ibovespa.
Performance of Bovespa and TBLE3 shares
Tractebel Energia’s shares depreciated 1.3% through the end of 2014, after a 15.5% gain in 2013. The IEE appreciated 3.5%, while the Ibovespa dropped 2.9% in the period. The TBLE3 quotation at December 31, 2014 was R$33.83/share, which sets our market capitalization at R$22.1 billion.
Over the year, TBLE3’s average daily trading reached R$27.3 million, a 19.8% increase compared to 2013, possibly reflecting the fact that our shares were admitted to the Ibovespa index in early 2014.
TBLE3 vs. IBOVESPA vs. IEEX – (Base 100 – 12/31/2013)