ANNUAL REPORT IN SUSTAINABILITY2016
G4-DMA Biodiversity|G4-DMA Effluents and waste|G4-DMA Products and services|G4-DMA Environmental compliance|G4-DMA Overall|G4-EN12|G4-EN26|G4-EN27

Aegea operates in compliance with environmental laws and adopts strict quality standards in order to mitigate the direct and indirect impacts of its operation. Its chief concern lies in expansion of sanitation infrastructure without damaging biodiversity and causing negative changes in regional ecological processes.

Every six months – or according to the requirements of environmental agencies – analyses are done upstream and downstream from the point where effluents are discharged into bodies of water. All parameters required by CONAMA Resolution No. 35710 are monitored in these analyses along with the impact on bodies of water, in order to assure that primary characteristics (such as river class, species and habitat) are not adversely affected. Also, monitoring reports on the effluents treated at all units and their respective discharge points are sent to environmental agencies and chief stakeholders on an annual basis.

The environmental impact related to Aegea’s activities can moreover be considered positive due to the appropriate disposal of in natura wastewater and to environmental training initiatives and adoption of treatment and waste disposal technologies. In this sense, it is worth noting the environmental recovery of Araruama Lake since the start of Prolagos operations (see “Manufactured capital”) and the over 35 million liters of wastewater that are no longer discharged into the Piracicaba River (SP) following the work of Águas do Mirante, in addition to the reduced risk of groundwater contamination from wells being drilled into aquifers, among other factors.

In Campo Grande (MS), Águas Guariroba works in partnership with the Municipal Secretariat of Environment and Urban Development, the National Water Agency (Agência Nacional de Águas – ANA), researchers and farmers in the Living Springs Program, aimed at increasing groundcover in the region and recovering riparian forests. Since 2008, when the initiative was created, around 300,000 trees have been planted and grown.

10. Discusses classification of bodies of water and environmental guidelines for their classification.
Sizes of water bodies and habitats affected by water discharge G4-EN26
Unit Names of water bodies and habitats
affected by water discharges
Size of water body
and habitat (km2)
Barras do Garça (MT)* Rio Araguaia 5.67
Rio Garças (Córrego Fundo) 11.73
Campo Verde (MT)* Rio São Lourenço 11.38
Rio das Motes 8.47
Cláudia (MT)* Ribeirão Leda 28.67
Diamantino (MT)* Rio Diamantino 5.56
Córrego do Ouro 10.81
Confresa (MT)* Córrego Gameleira 10.42
Guarantã do Norte (MT)* Afluente do Rio Braço Sul 10.68
Pedra Preta (MT)* Rio Jurigue 3.13
Peixoto de Azevedo (MT)* Rio Peixoto 6.20
Porto Espiridião (MT)* Rio Aguapeí 1.48
Primavera do Leste (MT)* Córrego Traíras 12.94
Sorriso (MT)* Córrego Gonçalves 63.56
Afluente do Rio Lira 6.55
Rio Lira 6.55
Rio Teles Pires 4.36
Águas Guariroba Córrego Bandeira 6.10
Córrego Imbirussú 58.00
Águas de Holambra Ribeirão Cachoeira 1.90
Águas de Matão Rio São Lourenço -
Águas do Mirante Rio Piracicaba 12.50
Ribeirão Tijuco Preto -
Ribeirão Anhumas -
Ribeirão Piracicamirim -
Prolagos Laguna Araruama 61.00
Rio Una 12.00
Canal da Marina 21.00
Serra Ambiental Canal dos Escravos 1.00
Ilha do Lameirão 8.91
Lagoa Jacuném 1.30
Lagoa Maringá 2.06
Córrego Barro Branco 6.20
Córrego Irema 1.10
Ribeirão Brejo Grande 11.00
Rio Jacaraípe 36.71
Córrego Laranjeiras 13.00
Córrego Manguinhos 1.60
Rio Reis Magos -
Afluente Dr. Robson 0.59
Córrego Garanhões 1.40
* Municipalities served by Nascentes do Xingu.

In the Company’s consolidated numbers, R$4,121,112.00 were invested in social and environmental programs in 2016. G4-EN31

Extent of the mitigation of environmental impacts of products and service G4-EN27
Theme Impact Initiatives
Use of materials Impact on soil due to the use of chemical products at labs and at
treatment stations.
Control and management of chemical products: risk analysis, qualification of suppliers, appropriate disposal, requirement for supply and availability of Material Safety Data Sheet (MSDSs) at locations where chemical products are used.
Water use Related to collection of surface water and groundwater for use in operations and for supply. Loss reduction programs; participation on local basin committees; forestry compensation projects; rational use of groundwater and Living Springs Program.
Emissions Direct (consumption of fossil fuels in operations and wastewater treatment processes) and indirect (power consumption, employee transportation, paper consumption, etc.) Greenhouse Gas (GHG) emissions. Monitoring of GHG emissions; measures and investments related to reducing consumption of energy and supplies; and choosing to use renewable fuels in fleets.
Effluents Risk of contaminating soil and bodies of water with the discharge of raw or treated effluents. Investment in new control technologies (hydraulic modeling, georeferencing, registration, etc.) and maintenance of assets aimed at mitigating problems in the operation, as well as monitoring and periodical analyses of the quality of receiving bodies and the parameters of the treated effluent.
Waste Risk of contamination of soil and water bodies by waste generated by the operation (sludge, sand, coarse waste), waste from civil construction (works), hazardous waste (packaging from chemical products, paints, solvents, etc.) and administrative processes. Investment in technologies for drying and appropriately disposing of sludge from WTSs and WWTSs; Solid Waste Management Program, including waste from civil works; and contracting of licensed companies to appropriately dispose of solid waste, including hazardous waste.
Sound pollution Possible exposure of employees to the sounds of machinery and equipment in civil works and at unit operations. Control and oversight by the Environmental Risk Prevention Program (PPRA, its acronym in Portuguese), including mapping of noises and use of the ear protection appropriate for each job.

Water

G4-DMA Water

During the year, the Company produced approximately 217 million cubic meters of water for its operations. This volume – coming from surface water (rivers, lakes and lagoons) and groundwater (aquifers and artesian wells) – was collected in accordance with the law, allowing for use of water resources and in a way that does not harm water sources. G4-EN8

Total water withdrawn by source (m3) G4-EN8
  Surface water1 Groundwater2 Total
  2016 2015 2014 2016 2015 2014 2016 2015 2014
Prolagos 37,375,874 37,053,368 35,515,384 - - - 37,375,874 37,053,368 35,515,384
Águas Guariroba 43,917,400 41,925,095 48,123,936 40,386,519 41,002,534 39,388,464 84,303,919 82,927,629 87,512,400
Nascentes do Xingu3 24,462,982 16,290,083 6,963 28,843,153 37,444,723 16,929 53,306,135 53,734,806 23,892
Águas de Timon 172,800 - - 18,643,365 18,963,648 - 18,816,165 18,963,648 -
Águas de Matão - - - 9,488,974 9,132,301 5,160,000 9,488,974 9,132,301 5,160,000
Águas de São Francisco do Sul 5,474,602 4,634,2605 - - - - 5,474,602 4,632,260 -
Águas de São Francisco - - - 4,012,144 5,032,657 4,660 4,012,144 5,032,657 4,660
Águas de Holambra4 1,565,078 - - 89,166 - - 1,654,244 - -
1. Wet areas, rivers, lakes and oceans.
2. Aquifers and artesian wells.
3. Since 2015, the Barra do Garças operation has been incorporated into Nascentes do Xingu.
4. Concession granted in late 2015.
5. Number revised and corrected for this edition of the report.


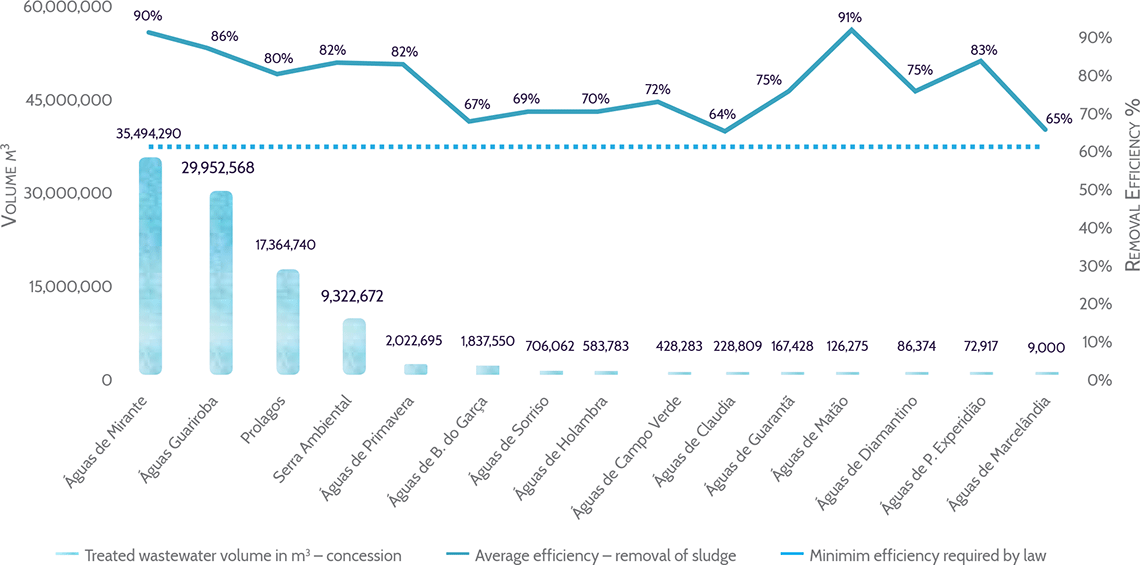
In 2016, 98,358,466 cubic meters of wastewater were treated. Águas de Mirante accounts for 36% of this volume, followed by Águas Guariroba (30%), Prolagos (18%) and Serra Ambiental (10%). The units maintain strict standards for removal of organic matter – in excess of what is required by environmental laws – and in most cases, efficiency is over 80%, which confirms the quality of effluent treatment by the Company.

Efficiency rates removal of organic material (BOD) at WWTSs and at Company units

Total water discharge, broken down by quality and destination1 G4-EN22
  2016 2015
Volume discharged (m3/year of treated wastewater) Location discharged Water quality – Biochemical Oxygen Demand (BOD) – % Volume discharged (m3/year of treated wastewater) Location discharged Water quality – Biochemical Oxygen Demand (BOD) – %
Prolagos 17,364,740 Laguna Araruama, Córrego Malhada (affluent of Rio Una) and Canal da Marina 80 16,822,832 Laguna Araruama, Córrego Malhada (affluent of Rio Una) and Canal da Marina 75
Águas Guariroba 29,952,568 Rio Anhanduí and
Córrego Imbirussu
75 29,163,369 Rio Anhanduí and
Córrego Imbirussu
72
Águas do Mirante 35,494,290 Rio Piracicaba, Ribeirão Tijuca Preta, Ribeirão Anhumas and Ribeirão Piracicamirim 90 37,986,825 Rio Piracicaba, Ribeirão Tijuca Preta, Ribeirão Anhumas and Ribeirão Piracicamirim 88
Águas de Matão 126,275 Rio São Lourenço do Turvo 91 120,778 Rio São Lourenço do Turvo 82
Águas de Holambra3 538,783 Ribeirão Cachoeira 70 - - -
Barra do Garças (MT)3 1,837,550 Rio Araguaia and Córrego Fundo 67 - - -
Campo Verde (MT)2 428,283 Rio das Motes 72 245,222 Rio das Motes 72
Cláudia (MT)2 228,809 Ribeirão Leda 64 164,908 Ribeirão Leda 67
Guarantã do Norte (MT)2 167,428 Affluent of Rio Braço Sul 75 65,596 Affluent of Rio Braço Sul 84
Pedra Preta (MT)2 72,646 Córrego Águas Claras 69 39,435 Córrego Águas Claras 62
Porto Esperidião (MT)2 72,917 Rio Aguapeí 83 12,974 Rio Aguapeí -
Primavera do Leste (MT)2 2,022,696 Córrego Traíras 82 1,365,525 Córrego Traíras 74
Sorriso (MT)2 706,082 Córrego Gonçalves and Affluent of Rio Lira 70 621,486 Córrego Gonçalves and Affluent of  Rio Lira 82
Serra Ambiental3 9,322,672 Canal dos Escravos, Ilha do Lameirão, Lagoa Jacuném, Lagoa Maringá, Córrego Barro Branco, Córrego Irema, Ribeirão Brejo Grande, Rio Jacareípe, Córrego Jacaré, Córrego Laranjeiras, Córrego Manguinhos, Rio Rei dos Magos, Affluent of Rio Dr. Robson and Córrego Garanhões 81 - - -
1. There is no Wastewater Treatment Station (WWTS) at the other units.
2. Municipalities served by Nascentes do Xingu.
3. Units began wastewater treatment operation in 2016.


In some regions, Aegea also reuses rainwater and water from washing WTS filters. At Armação de Búzios (RJ), São Pedro da Almeida and Iguaba Grande (RJ), Prolagos – in partnership with the municipal government – also withdraws water from secondary and tertiary WWTSs. This resource, which would otherwise be discarded, is therefore treated and contributes to the public supply. In total, the volume of water recycled accounts for 34% of water consumed during the year. G4-EN10


Total volume of water recycled and reused (m3) G4-EN10
  2016 2015
Águas Guariroba 832,200 409,750
Águas do Mirante 262,800 262,800
Prolagos 14,440 26,280
Águas de São Francisco do Sul 41,472 41,472
Barra do Garças (MT)1 131,170 65,700
Poconé (MT)1 16,256 6,844
Porto Esperidião (MT)1 6,746 8,213
Primavera do Leste (MT)1 84,238 33,763
Serra Ambiental2 9,300 -
Total 1,398,622 854,822
1. Municipalities served by Nascentes do Xingu.
2. Concessions gained in 2016.

Energy

G4-DMA Energy

Consolidated energy consumption at the Company in 2016 was 224,908.95 mWh, up by 11.2% year-over-year. This increase is in line with treatment rates: 15.7% more water was treated and distributed by the Company in 2016 than during the same consolidated period in 2015. The volume of wastewater collected and treated was also approximately 12% higher year-over-year, considering expansion projects and new concessions acquired.

Average power consumption for wastewater treatment is 0.35 kWh/m³, less than the energy consumed to treat water – which is approximately 0.60 kWh/m³. This difference is related to factors such as land declivity, number of lift stations and treatment methodology, among others.

Aegea invests in technologies aimed at efficiency and, as a result, lower electric power consumption in operational processes

Energy consumption (mWh) G4-EN3
  2016 2015
Águas Guariroba 88,134,770 81,622,556
Prolagos 44,083,250 44,737,255
Águas do Mirante 16,582,960 16,353,139
Nascentes do Xingu 33,911,380 32,252,982
Águas de Matão 10,472,730 10,124,645
Águas de São Francisco 2,169,000 2,827,908
Águas de São Francisco do Sul 2,651,990 2,780,360
Águas de Timon 10,522,080 9,099,631
Águas de Holambra* 1,115,000 -
Águas de Camboriú* 171,000 -
Águas de Penha* 5,298,980 -
Águas de Meriti* 9,795,800 -
Total 224,908,950 199,798,476
* Concessions gained in 2015 with data consolidated as of 2016.

Avoided consumption of 3.7 GWh is also notable, resulting from investments in efficiency (see “Intellectual capital”).

Reduction of energy consumption G4-EN6
  2016 2015
Avoided consumption (kWh) Reduced consumption (%) Avoided consumption (kWh) Reduced consumption (%)
Águas Guariroba1 0 0.0 1,734,988 2.1
Prolagos 654,005 1.46 15,200 0.0
Águas do Mirante 0 0.0 591,328 3.6
Nascentes do Xingu 0 0.0 831,802 2.6
Águas de Matão 0 0.0 127,248 1.3
Águas de São Francisco2 658,908 23.30 0 0.0
Águas de São Francisco do Sul2 128,370 4.62 0 0.0
Águas de Timon2 0 0.0 0 0.0
Total     3,300,566 1.7
1. In 2016, the concessionaire invested in efficiency actions focused on reducing cost, such as migration to the free market and rate restatement.
2. There was no avoided consumption in 2015, since these concessionaires had started operating that same year.
Next page Previous page