This gloomy panorama has already been borne out for industrial production, the IBGE reporting an accumulated decline of 8.3%, the largest contraction since the launch of the historical series in 2003. There has also been an impact on employment: according to the IBGE, the average jobless rate was 6.8% in the six leading metropolitan regions of the country in 2015 compared with 4.8% in 2014.
Tractebel Energia’s performance in 2015
GRI G4-EC1 G4-DMA (Economic performance)
The management of the Company’s financial capital is based on financial discipline with rigorous respect for the terms of receivables, disbursements and cash predictability.
|
| 2013
| 2014
| 2015
| Change 2015/2014
|
| Financial information (R$ million)
|
| Total assets |
12,637.6 |
13,609.6 |
15,300.7 |
12.4% |
| Shareholders’ equity |
5,364.6 |
5,654.9 |
6,642.1 |
17.5% |
| Net revenue from sales |
5,568.7 |
6,472.5 |
6,512.0 |
0.6% |
| Gross income |
2,657.0 |
2,497.7 |
2,708.9 |
8.5% |
| Income before financial result/taxes (Ebit)1 |
2,387.2 |
2,302.9 |
2,503.8 |
8.7% |
| Operating income |
2,001.7 |
1,956.6 |
2,033.2 |
3.9% |
| Net income |
1,436.7 |
1,383.1 |
1,501.3 |
8.5% |
| Ebitda2 |
3,042.6 |
2,895.1 |
3,114.6 |
7.6% |
| Financial indicators (R$ million)
|
| Total debt (loans, financing and debentures) |
3,495.4 |
3,988.5 |
3,758.4 |
-5.8% |
| Cash and cash equivalents and restricted deposits |
1,346.1 |
1,750.7 |
2,543.6 |
45.3% |
| Net debt |
2,149.3 |
2,237.8 |
1,214.8 |
-45.7% |
| ROCE3 (%) |
23.1 |
22.3 |
23.1 |
0.8 p.p. |
| Gross debt/Ebitda |
1.1 |
1.4 |
1.2 |
-0.2 p.p. |
| Net debt/Ebitda |
0.7 |
0.8 |
0.4 |
-0.4 p.p. |
| Participation of third party capital in relation to total assets (%) |
57.6 |
58.4 |
56.6 |
-1.8 p.p. |
| Operating margin (%) |
35.9 |
30.2 |
31.2 |
1.0 p.p. |
| Net margin (%) |
25.8 |
21.4 |
23.1 |
1.7 p.p. |
| Shares |
|
|
|
|
| Net earnings per share (R$) |
2.2011 |
2.1189 |
2.3000 |
8.5% |
| Average price per share4 – ON (R$) |
32.03 |
31.88 |
33.45 |
0.5% |
| Dividends per share (R$) |
2.2584 |
1.1876 |
1.2789 |
7.7% |
| Employee salaries and benefits |
243.3 |
263.7 |
292.3 |
10.8% |
| Payments to government |
1,618.3 |
1,681.3 |
1,858.7 |
10.6% |
|
1. Ebit = operating income + financial result.
2. Ebitda = net income + income tax and social contribution + net financial expenses + depreciation and amortization + provision impairments.
3. ROCE (return on employed capital) = result from the service/non-current assets.
4. Simple average of closing prices adjusted for dividends.
|
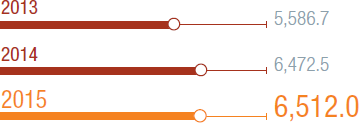
Net revenue from sales
Net revenue from sales
Net revenue from sales increased from R$6,472.5 million in 2014 to R$6,512.0 million in 2015, representing growth of R$39.5 million, or 0.6%. This increase is largely due to the following combination of factors: (i) R$822.5 million — an increase in the net average selling price; (ii) R$600.5 million — a reduction in revenue from transactions in the short-term market, including those conducted within the scope of the CCEE; and (iii) R$182.3 million — reduced energy sales.
Net revenue from sales (R$ million)
Net average selling price
The net average selling price was R$171.37/MWh, 14.9% higher than the R$149.20 reported for 2014. The price increase was largely due to monetary restatement of existing agreements as well as higher prices negotiated for new contracts.
Net average selling price* (in R$/MWh)
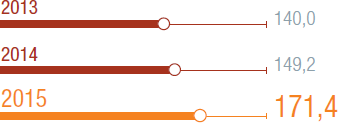
*Net of exports and sales taxes
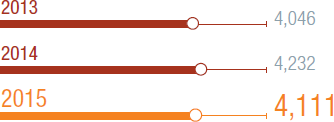
Sales volume
In 2015, energy sales volume was 36,012 GWh (4,111 average MW) against 37,072 GWh (4,232 average MW) recorded in 2014, a reduction of 1,060 GWh (121 average MW) or 2.9%. These variations were due due to a combination of the following key factors: (i) the expiry of agreements with distributors and trading companies, where the related energy was sold to free consumers or settled on the short-term market, attenuating the negative impacts arising from the systemic deficit in hydroelectric generation; and (ii) an increase in purchase volumes.
Sales volume (in average MW)
Comments on changes in net revenue from sales by client class
Distributors
The annual net sales revenue was R$3,046.6 million, a slight increase of 0.1% in relation to fiscal year 2014, when net revenue was R$3,044.0 million. This growth is a reflection of the association of the following variations: (i) R$246.1 million – growth of 8.4% in net average selling price; and (ii) R$243.5 million – reduction of 7.7%, or 1,434 GWh (163 average MW) in energy sales volume.
Trading companies
Net sales revenue from trading companies in 2015 amounted to R$209.0 million, 12.6% down from the R$239.2 million reported in 2014. The reduction represents the results of the following factors: (i) R$129.4 million — a fall of 42.8% or 881 GWh (101 average MW) in energy volume sold; and (ii) R$99.2 million — growth of 52.7% in the net average selling price.
Free consumers
In 2015, the Company reported revenue from this segment of R$2,915.7 million, 29.7% greater than the R$2,247.9 million posted in 2014. This expansion reflects: (i) R$477.2 million — growth of 20.4% in net average selling prices; and (ii) R$190.6 million — again a growth of 1,255 GWh (143 average MW) or 7.7% in energy sales volume.
Transactions in the short-term market, including those conducted through the CCEE
For the 12 months of 2015, there was a year-on-year decline of R$600.5 million in short-term transaction revenue from R$903.1 million in 2014 to R$302.6 million. The results recorded for this item include an increase in revenue of R$78.6 million, booked in the fourth quarter of 2015 and reflecting the renegotiation of hydrological risk for some of the Company’s plants where energy was commercialized under the Regulated Contracting Environment pursuant to Law 13,203/2015. A more detailed explanation of these variations is to be found in the item on the following page Details of Short-term Operations Including Transactions Conducted through the CCEE.
Selling costs of energy and services
The selling costs of energy and services were R$3,803.1 million, 4.3% or R$171.7 million less than the R$3,974.8 million reported in 2014. These variations are essentially due to the following factors:
- Electric energy purchased for resale | The year-on-year increase of R$506.5 million largely reflects: (i) price readjustments for existing agreements; and (ii) an increase in medium and long-term purchases of 552 GWh (63 average MW), particularly the acquisition of surplus energy from Jirau.
- Transactions in the short-term market including those conducted through the CCEE | On a year-on-year comparative basis, there was a reduction of R$972.4 million in costs. Such a variation reflects a reduction in costs of R$120.2 million in the fourth quarter 2015 relative to the effects arising from the completion of renegotiation of the hydrological risk. Greater details are given in the specific item below.
- Fuels for the production of electric energy | The growth of R$45.8 million over the preceding fiscal year was principally due to rising unit prices and the distribution costs of natural gas consumed at the William Arjona Thermoelectric Power Plant due to the depreciation of the Real against the US dollar.
- Charges for the use of and connection to the electricity grid | The increase of R$30.5 million between successive fiscal years was largely due to the annual readjustment in transmission tariffs.
- Materials and third party services | Costs rose by R$33.0 million in relation to 2014 mainly due to the greater demand for operational and maintenance services, notably at the Jorge Lacerda Thermoelectric Complex, the Charqueadas Thermoelectric Power Plant and the Salto Santiago and Estreito hydroelectric plants.
- Financial compensation for use of water resources (royalties) | There was a year-on-year increase in costs of R$7.5 million, in large part due to the annual price readjustment.
- Personnel | An increase of R$22.3 million, principally due to the annual adjustments in employee compensation and benefits.
- Depreciation and amortization | An increase of R$7.4 million over 2014 above all due to the incorporation of new assets in the Company’s generator complex.
- Net operational provisions | There was a negative effect of R$77.2 million on results in relation to 2014. The main factors driving increased provisioning costs were: (i) a R$92.3 million reversal of a provision for a civil action involving the collection of a surcharge on the Tariff for Use of the Transmission System (TUST) by Ponte de Pedra Hydroelectric Power Plant (UHPP), following a decision found in favor of the Company, thus reducing the risk of loss from a judicial process; (ii) a R$15.7 million reversal of a provision for a Brazilian Social Security Department (INSS) collection as a result of the Company’s agreement to the “REFIS da Copa” tax amnesty; (iii) a reduction of R$17.7 million in the provision for a civil action arising from the judicial dispute with a supplier (mentioned above); and (iv) R$12.2 million with respect to the constitution and reversal for payment in fourth quarter 2014 and first quarter 2015, respectively, of a provision for a civil action involving indemnification for expropriations at Cana Brava Hydroelectric Power Plant.
- Others | In 2015, there was a negative variation in relation to 2014 of R$70.6 million, essentially reflecting: (i) reversal of prescribed liabilities in 2014 for R$54.8 million relating to energy purchases and transmission overheads; (ii) payment of R$6.1 million in indemnifications for expropriations which took place in 2015; and (iii) an increase of R$10.0 million in the premium on the Company’s renewed insurance policies.
Details of short-term operations including transactions conducted on the Electric Energy Trade Board (CCEE)
Short-term operations are classified as energy purchase or sale operations not exceeding six months and having the optimization of Tractebel’s exposure on the CCEE as their prime objective. Consequently, the price for these operations is dictated by the Price for Settlement of Differences (PLD) or spot price. This item also includes transactions conducted on the CCEE, given the volatile, seasonal and therefore short-term nature of the results originating from those booked at CCEE. Additionally, long and short positions are settled at the spot price, and therefore similar to the short-term operations described above.
As to the transactions conducted through the CCEE, the various monthly credit or debit entries to the account of an agent are summarized in a single billing as a receivable or a payable. This therefore requires an entry to either an income or an expense account. In this context, it is worth pointing out that due to adaptations to the Company’s portfolio management strategy, changes have been taking place in billing profile in the past few years. Such fluctuations complicate direct comparison of the elements comprising each billing in the two years – the reason for including this specific topic – allowing us to analyze the oscillations of the principal elements involved in spite of allocation being to either income or expenses according to the credit or debit nature of the billing to which they relate.
WITH GROWTH OF 20.4% IN NET AVERAGE SELLING PRICES OF ENERGY, THE COMPANY’S NET REVENUE FROM FREE CONSUMERS REACHED R$ 2,915.7 MILLION
7.6 % THERE WAS A YEAR-ON-YEAR INCREASE OF 7.6% FROM R$2,895.1 MILLION TO R$3,114.6 MILLION IN 2015
Generically speaking, these elements are income or expense items arising for example from: (i) the application of the Energy Reallocation Mechanism (MRE); (ii) the Assured Energy Adjustment Factor which occurs when generation in relation to allocated energy from the plants which are part of the MRE is greater (Secondary Energy) or less (Generation Scaling Factor – GSF); (iii) the so-called “sub-market risk”; (iv) dispatch triggered by the Risk Aversion Curve (CAR); (v) the application of System Service Charges (ESS), resulting in dispatch diverging from the thermal plants order of merit; and (vi) naturally, exposure (a short or long position in the monthly accounting) which will be settled at the PLD price.
For 2015 as a whole, the net result (the difference between revenues and costs – less taxes on revenues and costs) from short-term transactions, including those executed through the CCEE, was positive at R$235.7 million against a negative result of R$136.2 million in 2014, that is, an improvement of R$371.9 million between comparative years.
This variation is largely due to a combination of the following factors: (i) a major reduction in the negative effect of the adjustment in physical guarantee in relation to the GSF; (ii) a decline in the long position on the CCEE, a reflection of the Company’s monthly power allocation strategy; (iii) a decrease in thermoelectric exposure due to the significant reduction in average PLD in 2015 in spite of the overall increase in exposed volume; (iv) recognition in fourth quarter 2015 of the effects of signing up to the hydrological risk renegotiation at some of the Company’s plants where energy is sold in the Regulated Contracting Environment (ACR) pursuant to Law 13,203/2015; (v) reduced impact of results from transactions on the CCEE in the fourth quarter 2015 compared with the same quarter in 2014 with the recognition of amounts due to the recovery from the negative impacts of operations through the CCEE in 2014 following forced stoppages at company generator units; (vi) increase in revenue with ancillary services; (vii) the increase in MRE revenue linked to the Energy Optimization Tariff (TEO); (viii) the positive effects of short-term transactions in 2015; and (ix) the reversal in the second quarter 2014 of the provisions for supposed costs relative to the participation of generators in the prorating of System Service Charges (ESS) as per CNPE Resolution 03, given the reduced risk of loss from a judicial action contesting the collection of these amounts. The effects mentioned in items (ii) and (v) attenuated the positive impact of the remaining factors.
Worthy of note also was the significant reduction in year-on-year average PLD, thus contributing significantly to mitigating negative impacts stemming from the application of the GSF and thermoelectric exposure, and on the other hand, to the reduction in the positive effects arising from surplus energy settled through the CCEE.
On a year-on-year comparative basis, the average PLD for the South and Southeast/Central-Western submarkets declined by 57.8% from R$675.81/MWh in 2014, to close at R$285.41 in 2015.
With the enactment of Law 13,203/2015 and pursuant to Aneel guidelines, in December 2015 the Company formally signed up to the renegotiation of the hydrological risk for plants where energy is sold through the Regulated Contracting Environment. The decision also reflected the need to mitigate the negative effects of the GSF on generator plants subject to the Energy Reallocation Mechanism – MRE. As a condition to signature, the Company agreed to remove all preliminary injunctions impeding the payment of the GSF at its plants.
This renegotiation was made retroactive to January 2015 and resulted in the reimbursed amount (net of the risk premium) of R$223.2 million, booked to the asset Renegotiation of hydrological risk to appropriate. This amount will be offset against payment of future risk premiums to be incurred by the Company. The following table shows the results to be reimbursed following renegotiation for 2015 and the extension of the term for amortization of unit premiums under the ACR mechanism by product class.
Criterion for renegotiation of the hydrological risk
| Plant
| Product
| Amount
Renegotiated
(average MW)
| Amount
Renegotiated
(MW)
| Net unit reimbursement (R$)
| Total reimbursement (R$ million)
| Term* (years)
|
| Cana Brava HPP |
SP92 |
261.66 |
2,292,177 |
18.26 |
41.9 |
13.25 |
| Itá HPP |
SP92 |
336.00 |
2,943,360 |
18.26 |
53.7 |
13.25 |
| Machadinho HPP |
SP92 |
84.04 |
736,190 |
18.26 |
13.4 |
13.25 |
| Ponte de Pedra HPP |
SP95 |
123.55 |
1,082,315 |
23.80 |
25.8 |
7.17 |
| Salto Santiago HPP |
P97 |
150.00 |
1,314,000 |
24.36 |
32.0 |
2.92 |
| São Salvador HPP |
SP91 |
142.13 |
1,245,048 |
16.52 |
20.6 |
17.25 |
| Estreito HPP |
SP91 |
247.13 |
2,164,859 |
16.52 |
35.8 |
17.25 |
| Total |
- |
1,334.51 |
11,777,950 |
- |
223.1 |
- |
| *Extension of payment term for the premium from January 2016 for reimbursement of the 2015 results. |
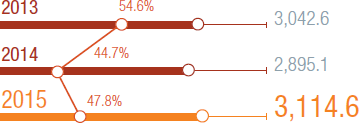
Ebitda and Ebitda Margin
In 2015, Ebitda increased by 7.6% or R$219.5 million
from R$2,895.1 million in 2014 to R$3,114.6 million. The Company reported an Ebitda margin of 47.8%, an increase of 3.1 p.p. in relation to 2014. This performance largely reflects a combination of the following factors: (i) an increase of R$640.2 million in net revenue from sales of contracted energy; (ii) growth of R$506.5 million in energy purchases for resale; (iii) the positive impact of R$426.4 million in transactions conducted in the short-term market including those executed within the scope of the CCEE; (iv) reversal in 2014 of a provision of R$54.5 million covering the impacts of CNPE Resolution 03, published in 2013; (v) a R$45.8 million increase in fuel consumption; (vi) an increase of R$30.5 million in charges for the use of the electricity network and connection; (vii) a reduction of R$17.7 million in 2015 in relation to the preceding year of a provision for a civil action arising from a legal dispute with a fuel supplier; (viii) reversal in 2014 of provisions for the collection of a surcharge on Ponte de Pedra Hydroelectric Power Plant’s Tariff for Use of the Transmission System in the amount of R$92.3 million; (ix) reversal of prescribed liabilities in 2014 amounting to R$54.8 million; and (x) an increase of R$80.4 million in other costs and operational expenses. If the non-recurring events in 2014 mentioned in items (iv), (viii) and (ix) are factored out, the increase in Ebitda would have been R$421.1 million or 15.6% greater in 2015 in relation to the preceding year.
Ebitda* (in R$ million) and Ebitda margin
*Ebitda represents net income + income tax and social contribution + financial expenses, net + depreciation and amortization.
The following table reconciles net income with Ebitda.
Reconciliation of net income with Ebitda
| Amounts (in R$ million) |
2013 |
2014 |
2015 |
Change 2015/2016 (%) |
| Net Income |
1,436.7 |
1,383.1 |
1,501.3 |
8.5 |
| (+) Income tax and social contribution |
565.0 |
573.5 |
531.9 |
-7.3 |
| (+) Financial ex-penses, net |
385.5 |
346.3 |
470.6 |
35.9 |
| (+) Depreciation and amortization |
582.6 |
592.1 |
600.4 |
1.4 |
| (+) Provision for impairments |
72.8 |
0.0 |
10.3 |
- |
| Ebitda |
3,042.6 |
2,895.1 |
3,114.6 |
7.6 |
Financial result
- Financial Income | On a comparative year-on-year basis, financial income increased R$74.4 million, or 36.0% from R$206.4 million in 2014 to R$280.8 million in 2015. This variation is largely the result of the following factors: (i) an increase of R$138.8 million in revenue from financial investments; (ii) a reversal of R$61.4 million in 2014, corresponding to interest and monetary restatement of prescribed liabilities already mentioned in the item Costs of Energy Sales and Services – Others; (iii) recognition in 2014 of R$11.0 million in gains as a result of legal rulings in favor of the Company; and (iv) an increase of R$4.0 million in the monetary restatement of court escrow deposit accounts.
- Financial expenses | On a comparative year-on-year basis, expenses rose from R$552.7 million to R$751.4 million, a R$198.7 million or 36.0% increase, resulting largely from the combination of the following variations: (i) growth of R$75.6 million in interest and monetary restatement of debt. ;(ii) an increase of R$138.3 million in interest and monetary restatement on concession fees payable; (iii) a decrease of R$17.9 million in interest and monetary restatement of provisions and contingencies; and (iv) an increase of R$4.5 million in currency translation expenses on corporate debt.
Income tax (IT) and Social Contribution (CSLL)
For the full 12-month period of 2015, income tax and social contribution expenses declined from R$573.5 million in 2014 to R$531.9 million in 2015: a difference of R$41.6 million. This variation also reflects interest on shareholders’ equity credited to shareholders during the year. Tax rates on profits in 2015 and 2014 were 26.2% and 29.3%, respectively.
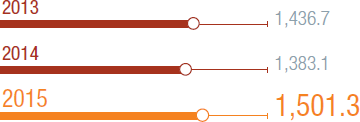
Net income
Net income increased from R$1,383.1 million in 2014 to R$1,501.3 million in 2015, an R$118.2 million, or 8.5% increase. This variation was principally due to: (i) a R$219.5 million improvement in Ebitda; (ii) an increase of R$124.3 million in net financial expenses; (iii) an increase of R$8.3 million in depreciation and amortization expenses; (iv) recognition of asset impairment of R$10.3 million in fiscal year 2015; and (v) a R$41.6 million reduction in income tax and social contribution expenses.
Net income (R$ million)
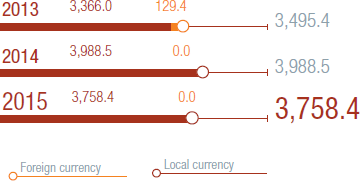
Debt
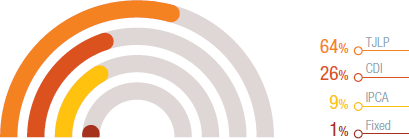
Company’s gross consolidated debt as at December 31, 2015, represented mainly by loans, financing and debentures, net of hedge operations, totaled R$3,758.4 million, a decrease of 5.8% or R$230.1 million, compared to the position as at December 31, 2014. Of total corporate debt at the end of the period, 34.2% was currency denominated (29.9% at the end of 2014). However, if the contracted swap operations are taken into account, currency exposure was zero at the end of the period under analysis.
Gross debt (R$ million)
THE COMPANY INVESTED R$917.3 MILLION IN THE ACQUISITION OF PROJECTS AND IN THE CONSTRUCTION, MAINTENANCE AND REVITALIZATION OF ITS GENERATOR COMPLEX
Maturing debt schedule (R$ million)
The variation in Company debt is largely related to a combination of the following factors: (i) drawdowns from the National Development Bank – BNDES and its financial agents in the aggregate amount of R$104.6 million for investments in the modernization of the Salto Santiago and Passo Fundo HPPs and the Jorge Lacerda Thermoelectric Complex and for the expansion work at the Ferrari Thermoelectric Power Plant; (ii) loan agreements in US dollars equivalent to R$27.0 million, subject to swap operations for protecting the total cash flow from currency appreciation; (iii) R$394.4 million in charges payable together with monetary restatement and currency translation effects; and (iv) R$760.7 million in amortization of loans, financing and debentures.
The average weighted nominal cost of debt at the end of 2015 was 11.1%.
Breakdown of debt
In December 31, 2015, the Company’s net debt (total debt less derivative operations, deposits earmarked in guarantee of debt servicing and cash and cash equivalents) was R$1,214.8 million, a reduction of 45.7% compared with the end of 2014.
|
| 12/31/2013
| 12/31/2014
| 12/31/2015
| Change 2015/2014 (%)
|
| Gross debt |
3,496.6 |
4,052.7 |
4,247.2 |
4.8 |
| Result of derivative operations |
(1.1) |
(64.2) |
(488.8) |
660.9 |
| Deposits earmarked for debt servicing |
(121.9) |
(146.0) |
(146.8) |
0.5 |
| Cash and cash equivalents |
(1,224.3) |
(1,604.7) |
(2,396.9) |
49.4 |
| Total net debt |
2,149.3 |
2,237.8 |
1,214.8 |
-45.7 |
Investments
In 2015, the Company invested a total of R$917.3 million in the construction, maintenance and revitalization of its generator complex and in the acquisition of projects. Construction work at the Santa Mônica and Campo Largo wind parks, the Pampa Sul TPP, the Assú Photovoltaic Complex and the Ferrari Thermoelectric Power Plant involved further investments of R$493.6 million and will translate into an increase of about 11% in the Company´s installed capacity over the next four years. A further R$222.9 million was dedicated to investments in maintenance with a view to the continuation of a high plant uptime factor, this being 97.4% in 2015. A total of R$134.5 million was invested in the modernization of the Salto Santiago and Passo Fundo plants – permitting a 12.2 average MW increase in the Company’s total physical guarantee in 2015. In 2015, the Company also acquired projects amounting to a total of R$66.3 million.
Proposed dividends
The total payout of profits for the 2015 fiscal year as proposed by Tractebel Energia Board of Directors, including interest on shareholders’ equity, to be ratified by the Annual General Meeting, amounted to R$834.8 million, equivalent to R$1.2788764646 per share or 55% of net adjusted distributable income.
Track record of dividend distribution (payout) (2005-2015)
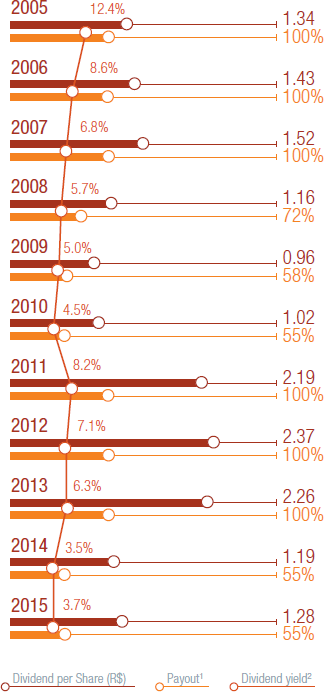 1. Considering the adjusted net income for the fiscal year. 2. Based on the closing price weighted by share volume in the period.
THE COMPANY IS A COMPONENT OF THE SPECIAL CORPORATE GOVERNANCE (IGC) AND SPECIAL TAG ALONG (ITAG) STOCK INDICES
R$21.9 bi
TRACTEBEL ENERGIA’S MARKET CAPITALIZATION AT THE END OF FISCAL YEAR 2015. THE COMPANY’S CLOSING PRICE FOR THE YEAR WAS R$ 33.49/SHARES
Share Performance
45.7%
REDUCTION IN COMPANY NET DEBT IN RELATION TO 2014
Capital markets
Since its listing on BM&FBovespa’s Novo Mercado, Tractebel has become a component of the Special Corporate Governance Stock Index (IGC) and the Special Tag Along Stock Index (ITAG), incorporating those companies offering greater protection to minority shareholders in the event of the sale of a controlling stake. The Company’s shares are also included in the Corporate Sustainability Stock Index (ISE), comprising companies with a recognized commitment to social and corporate responsibility, as well as the Electric Energy Stock Index (IEE), which is a sector index made up of the more significant listed companies in the industry.
Throughout 2015 the Company’s shares remained as components of the country's leading sotck index, the BM&FBovespa. In June, the Company was also included in the Euronext-Vigeo EM 70 – a stock index composed of companies in developing countries ranked highest by performance in corporate responsibility. Vigeo is the leading rating agency for corporate social responsibility and analyzes approximately 330 indicators.
Tractebel Energia’s common shares are traded on the São Paulo Stock Exchange (BM&FBovespa) under the TBLE3 symbol. In addition, the Company’s Level I American Depositary Receipts (ADRs) trade on the US Over-the-Counter OTC market under the TBLEY symbol at a ratio of one ADR for each common share.
Share performance
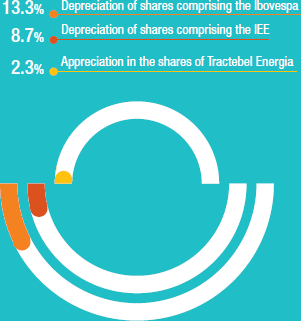
The benchmark Ibovespa stock index for the Brazilian equities market reported a depreciation of 13.3% in 2015, the third consecutive year in which the index has declined. This is a reflection of the economic and political uncertainty surrounding the country, which was recently downgraded by two risk classification agencies to a sub-investment
grade rating.
Set against this scenario, Tractebel Energia’s shares appreciated 2.3% while the IEE and Ibovespa both reported a depreciation of 8.7% and 13.3%, respectively. The Company’s shares recorded a closing price for the year of R$33.49/share, equivalent to a market capitalization of R$21.9 billion.
The average daily trading volume for TBLE3 was R$27.9 million, an increase of 2.3% in relation to 2014.
TBLE vs. IBOVESPA vs. IEEX (Baseline 100 – December 31, 2014)