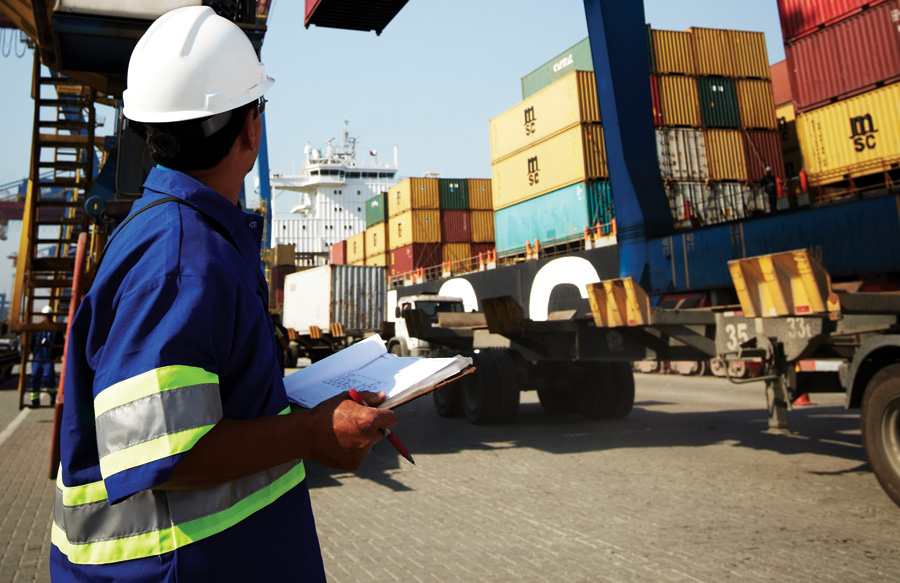
OPERATING & FINANCIAL PERFORMANCE
| OPERATING INDICATORS | |||
| (Units) | 2011 | 2010 | Change |
|---|---|---|---|
| PORT TERMINALS | |||
| Quay Operations | 1.001.875 | 938.924 | 6,7% |
| Quay Operations | 781.523 | 742.681 | 5,2% |
| Empty Containers | 220.352 | 196.243 | 12,3% |
| Storage Operations | 179.202 | 182.900 | -2,0% |
| VEHICLES TERMINAL | |||
| Vehicles Handled | 205.603 | 154.211 | 33,3% |
| LOGISTICS | |||
| Storage Operations | 74.632 | 67.848 | 10,0% |
OPERATING INDICATORS
The economic expansion in developing countries gave impetus to cargo flow through at the largest port in Brazil, making the volume operated in the Santos Brasil port terminals exceed its historic mark of 1 million containers handled in the year, a 6.7% increase in relation to 2010.This performance, which represents approximately twice the expansion in Brazilian GDP (Gross Domestic Product) in 2011, was possible as a result of the substantial advances in operating efficiency made by the Company in its main terminal, Tecon Santos.
The annual performance could have been even better had the second semester of 2011 not been affected by the drop in sugar shipments, the main export cargo from the terminals, which presents a concentration in shipments in the second semester. The volatility of the exchange rate also caused uncertainty, which reduced imports slightly in the second half of the year.
The full-empty container mix registered 78% full in the yearly accumulated result, with good performance of long haul full containers in the course of the year, with a 3.4% increase in 2011.
The volume of containers stored at Santos Brasil port terminals in 2011 presented a 2.0% reduction in comparison with 2010 due to the reduced rate of withholding of import containers landed for storage at Tecon Santos, which decreased from 52% in 2010 to 47% in 2011.
Vehicles handling registered at the Vehicles Terminal was 33.3% higher in relation to 2010. This performance was influenced by exports and imports, which increased 38% and 26%, respectively.
Santos Brasil Logística's bonded storage operations increased 10.0% in relation to 2010 due to the increased market share in the Port of Santos and more integrated logistics services based in São Bernardo do Campo and Jaguaré distribution centers. The services offered comprise the cargo reception in port terminals, passing through CLIAs (Industrial & Logistics Customs Centers) and distribution centers until the road container transport and fractioned cargo distribution.
ECONOMIC-FINANCIAL RESULTS
| GROSS SERVICE REVENUE | |||
| (R$ million) | 2011 | 2010 | Change |
|---|---|---|---|
| PORT TERMINALS | 997,5 | 787,2 | 26,7% |
| Quay Operations | 581,2 | 515,2 | 12,8% |
| Storage Operations | 416,3 | 272,0 | 53,1% |
| VEHICLES TERMINAL | 65,1 | 30,6 | 112,7% |
| LOGISTICS | 216,1 | 165,5 | 30,6% |
| Consolidated | 1.278,7 | 982,7 | 30,1% |
GROSS REVENUE
Revenue from storage operations grew by an expressive 53.1% over the period, in excess of the variation in stored container volume. This difference is due to readjustments in the price of storage services at Tecon Santos and longer dwell time (storage time) of stored containers, which increased from 15.4 days in 2010 to 16.4 days in 2011, positively influencing turnover.
With 112.7% growth in 2011, revenue from the Vehicles Terminal was the main highlight of the year amongst the Company's business segments. This performance was achieved as a result of the following factors: (i) substantial growth in handling; (ii) extended storage time; and (iii) annual price readjustment.
In the logistics segment, gross revenue rose 30.6% in comparison with the previous year. Factors contributing to this result: (i) growth in cargo volume stored at the CLIAs in the Port of Santos; (ii) the Company's commercial efforts to increase integrated logistics services with the aim of serving customers that use the port; (iii) expansion of services with the Distribution Center and road transport; and (iv) readjustments in service prices.
NET REVENUE
In 2011, the consolidated net revenue totaled R$1,124.7 million, compared with R$865.5 million in 2010, a significant increase of 29.9%, in line with the growth in gross revenue.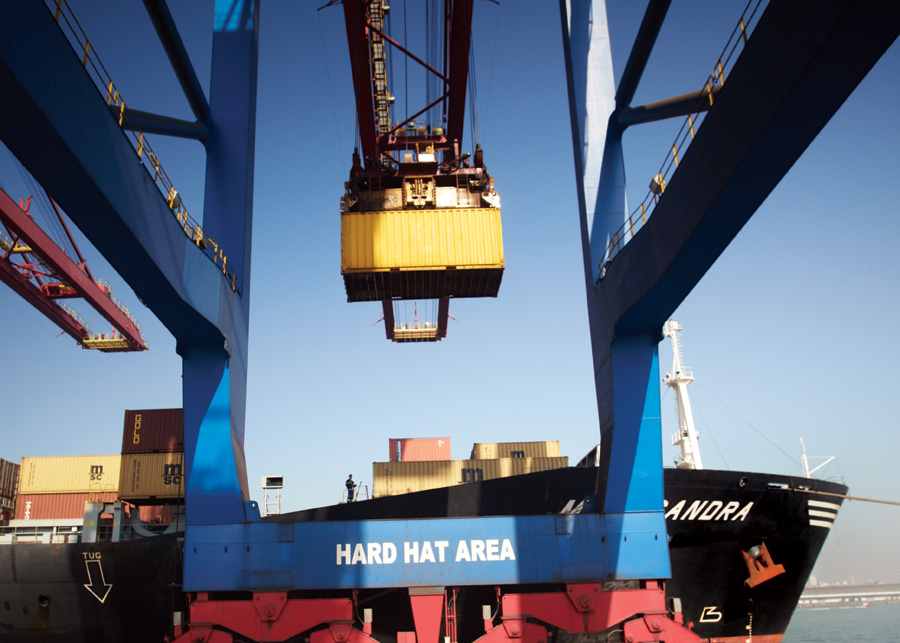
| COST OF SERVICES RENDERED | |||
|---|---|---|---|
| (R$ million) | 2011 | 2010 | Variação |
| PORT TERMINALS | |||
| Handling Costs | 130,2 | 123,0 | 5,9% |
| Personnel Costs | 136,2 | 108,5 | 25,5% |
| Leasing & Infrastructure | 56,1 | 45,8 | 22,5% |
| Depreciation & Amortization | 78,4 | 69,0 | 13,6% |
| Other Costs | 73,0 | 45,0 | 62,2% |
| Total | 473,9 | 391,3 | 21,1% |
| VEHICLES TERMINAL | |||
| Handling Costs | 13,0 | 8,5 | 52,9% |
| Leasing & Infrastructure | 3,5 | 3,0 | 16,7% |
| Depreciation & Amortization | 9,1 | 9,1 | 0,0% |
| Other Costs | 3,4 | 1,4 | 142,9% |
| Total | 29,0 | 22,0 | 31,8% |
| LOGISTICS | |||
| Fuel & Freight | 40,2 | 31,9 | 26,0% |
| Personnel Costs | 44,5 | 32,2 | 38,2% |
| Depreciation & Amortization | 5,6 | 4,1 | 36,6% |
| Other Costs | 33,3 | 36,9 | -9,0% |
| Total | 123,6 | 105,1 | 17,6% |
| CONSOLIDATED | 626,5 | 517,8 | 21,0% |
COST OF SERVICES RENDERED
 PORT TERMINALS
Handling costs (casual labor force, TUP-channel fee and other variable costs): the 5.9% growth in relation to 2010 is the result of the evolution in container handling in quay operations.
Personnel costs: 25.5% increase observed, due to the following factors: (i) increase in permanent staff number as a result of the greater demand planned aimed for increased productivity and capacity; and (ii) wage readjustment granted to employees, subject to union negotiations.
Leasing & infrastructure: the R$10.4 million increase recorded in 2011 is the result of contract readjustments set forth in the respective concession contracts and of the change in the minimum handling quantity at Tecon Imbituba. As already announced by the Company, this terminal is committed to handling a minimum of 65,000 containers in its first year of activity, 150,000 in the second year, 280,000 in the third year and 360,000 as from the fourth year of activities, in which the contract started in April 2008.
Depreciation and amortization: an increase of 13.6% was recorded due to the commissioning of new quay line at Tecon Imbituba and to the operations with the new equipment.
Other costs: the other costs registered a 62.2% increase over the year due to maintenance expenditure, which were R$15.7 million higher than the investment made in the previous year, a result of the Company's search for increased productivity.
VEHICLES TERMINAL
The increase in costs was basically due to the greater number of vehicles handled in 2011.
LOGISTICS
Fuel & freight: the 26.0% increase in 2011, compared with 2010, was primarily due to: (i) the increase in the handling of cargo storage operations and the rendering of shipping and distribution services; and (ii) the readjustment of prices charged by outsourcers in the provision of road shipping services.
Personnel costs: the 38.2% increase in the year-to-year comparison is the result of wage readjustment pursuant to class collective bargaining and the increase in permanent staff members in 2011 to help attend to new customers at the Jaguaré Distribution Center.
Depreciation & Amortization: the 36.6% increase is explained by investments made in new equipment, purchased to meet the increased demand.
Other costs: the reduction recorded is the result of non-recurring expenditure incurred in 2010, which was not incurred in 2011, amongst which are expenses from repairs to the CLIA Alemoa cargo warehouse because of a fire that occurred in October 2010.
| OPERATING EXPENSES | |||
| (R$ million) | 2011 | 2010 | Change |
|---|---|---|---|
| PORT TERMINALS | |||
| Sales | 16,8 | 13,2 | 27,3% |
| General & Administrative | 43,9 | 40,3 | 8,9% |
| Total | 60,7 | 53,5 | 13,3% |
| VEHICLES TERMINAL | |||
| Sales | - | - | - |
| General & Administrative | 0,3 | 0,1 | 200,0% |
| Total | 0,3 | 0,1 | 200,0% |
| LOGISTICS | |||
| Sale | 14,1 | 10,0 | 41,0% |
| General & Administrative | 13,2 | 10,7 | 23,4% |
| Total | 27,3 | 20,7 | 31,9% |
| CORPORATE | |||
| General & Administrative | 47,8 | 47,3 | 1,1% |
| Depreciation & Amortization | 15,6 | 16,5 | -5,5% |
| Total | 63,4 | 63,8 | -0,6% |
| Consolidated | 151,7 | 138,1 | 9,8% |
CONSOLIDATED OPERATING EXPENSES TOTALED R$151.7 MILLION IN 2011, 9.8% UP ON THE
PREVIOUS YEAR.
OPERATING EXPENSES
In the port terminal segment, the increased storage revenue raised commissioning costs incurred with freight forwarders (calculated over storage invoicing). In the case of general expenditure, wage readjustments inflated personnel expenditure and service provision contracts were readjusted as per contract specifications.
The Vehicles Terminal recorded a 200% increase in costs due to the greater service demand in 2011, which led to a large increase in operated volume.
In logistics, expenditure was equally inflated by the increase in forwarder commissioning costs, a consequence of the increase in operations and invoicing and of the wage readjustments granted as a result of class bargaining agreements.
The increase observed in corporate expenditure was primarily caused by the recognition as expenses of intangible assets to the amount of R$3.5 million corresponding to the land occupation projects of the Prainha area and the Road Complex in Imbituba. These projects are subject to analysis and approval by public sector authorities and if approved the Company is entitled to reimbursement of any outlay made.
| EBITDA & EBITDA MARGIN | ||||||
| (R$ million) | 2011 | Margin |
2010 | Margin |
Change |
Change Margi |
|---|---|---|---|---|---|---|
| Port Terminals |
430,1 | 48,6% | 324,1 | 46,4% | 32,7% | 2,2 p.p. |
| Vehicles Terminal | 34,6 | 63,1% | 13,0 | 49,9% | 166,2% | 13,2 p.p. |
| Logistics | 40,0 | 21,6% | 20,3 | 14,4% | 97,0% | 7,2 p.p. |
| Corporate | (47,8) | - | (47,3) | - | - | - |
| Consolidated | 456,9 | 40,6% | 310,1 | 35,8% | 47,3% | 4,8 p.p. |
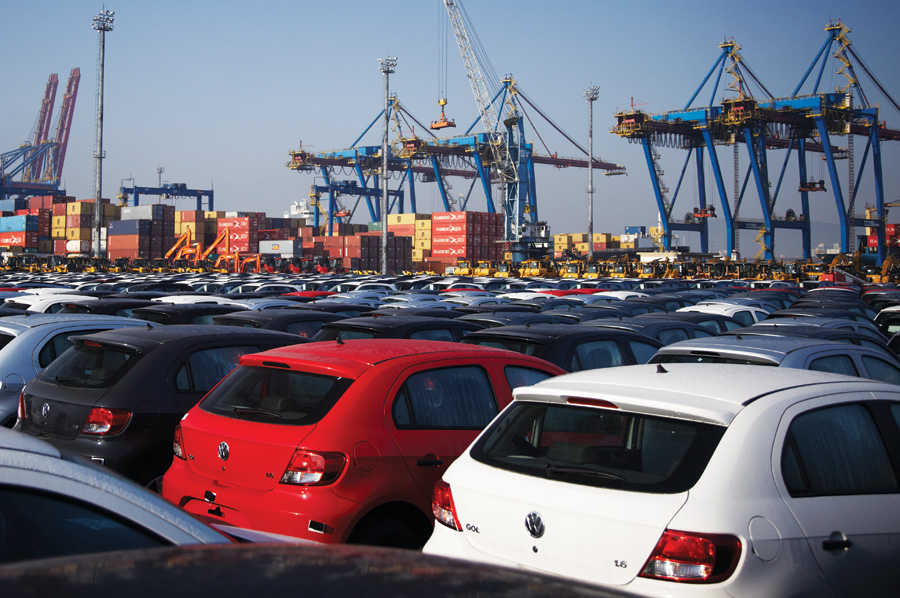
O Terminal de Veículos movimentou 33,3% a mais em 2011.
STRONG 47.3% EBITDA GROWTH.
EBITDA & EBITDA MARGIN
The consolidated EBITDA recorded signiἀcant growth of 47%, totaling R$456.9 million, with a margin of 40.6% – 4.8 percentage points above the margin of the previous year.The port terminal segment recorded growth of 32.7% and an increase in proἀt margin of 2.2 percentage points as a result of: (i) the increase in volume handled in port opera-tions; (ii) savings on a higher scale at Tecon Santos; and (iii) readjustment in quay storage and operating services.
At Tecon Santos, EBITDA totaled R$456.3 million with a margin of 54% in the year. Tecon Imbituba, still in the maturation stage, ended 2011 with negative EBITDA of R$25.4 million and Tecon Vila do Conde with negative EBITDA of R$759,000.
Vehicles Terminal EBITDA totaled an expressive increase of R$34.6 million, growth of 166.2% and an increase of 13.2 percentage points in the margin. This result is a consequence of: (i) the higher volume of vehicles handled; (ii) service price readjustment; and (iii) the expressive productivity of this terminal.
Santos Brasil Logística's EBITDA presented an expressive increase of 97% compared with the previous year, advancing 7.2 percentage points in the EBITDA margin. This performance is due to the following factors: (i) volume stored at the CLIAs in the Port of Santos; (ii) commercial efforts by the Company to increase integrated logistics services with the aim of primarily attending to customers that use the port; (iii) expansion of services by way of a new Distribution Center in the city of São Paulo; and (iv) readjustments in service prices.
| NET INCOME | |||
| (R$ million) | 2011 | 2010 | Change |
|---|---|---|---|
| EBITDA | 456.9 | 310.1 | 47.3% |
| Depreciation & Amortization | (110.4) | (100.5) | 9.9% |
| EBIT | 346.5 | 209.6 | 65.3% |
| Financial Result | (47.0) | (3.2) | - |
| Corporate Income Tax (IRPJ) / Social Contribution on Net Income (CSLL) |
(53.2) | (95.2) | -44.1% |
| Minority Stockholders | 0.2 | 0.8 | - |
| Net Income | 246.6 | 112.0 | 120.2% |
NET INCOME
In 2011, Santos Brasil's net income rose 120.2%, positively influenced by the increase in the Company's operating result and the incorporation of Tecon Santos by Santos Brasil Participações S/A.
The better operating result is a consequence, primarily, of an increase in net revenue in container and vehicle terminal segments which results from the market share gains in these activities as a result of the Company's significant operating productivity. Therefore, the net income was positively affected and the net margin reached 22% in 2011, 9.0 percentage points more than the previous year.
IMPRESSIVE 120.2% NET INCOME GROWTH.
| DEBT & CASH EQUIVALENTS | ||||
| (R$ million) | Moeda | 12.31.2011 | 12.31.2010 | Change |
|---|---|---|---|---|
| Short Term | Domestic | 295.1 | 60.5 | 387.8% |
| Foreign | 51.3 | 101.7 | -49.6% | |
| Long Term | Domestic | 264.9 | 78.4 | 237.9% |
| Foreign | 93.8 | 225.7 | -58.4% | |
| Total Indebtedness | 705.1 | 466.3 | 51.2% | |
| Cash Equivalents | 294.9 | 107.5 | 174.3% | |
| Net Debt | 410.2 | 358.8 | 14.3% | |
DEBT & CASH EQUIVALENTS
On December 31, 2011, the Company's total consolidated indebtedness reached a total of R$705.1 million. In the month of December, R$150 million capitalization was captured through an Export Note of Credit with an annual cost of CDI + 1.6% and a three year term. The object of this operation was the payment of loans with short-term expiry dates and to reduce the cost of the Company's debt.
Consequently, cash equivalents rose 174.3% in the year and the net debt totaled R$410.2 million, with an increase of 14.3%, corresponding to 0.9 times the Company's 12 month accumulated EBITDA.
In addition, for the fiscal year of 2011, the Company also announced the distribution of Interest on Equity and Dividends in the amount of R$187.4 million for its stockholders.
Due to the healthy operating income throughout the year and with the prospect of improved cash generation by the Company, due to both the increase in operating income and the low need for investment in the coming years, the rating agency Standard & Poor's raised the rating assigned to Santos Brasil in its National Brazil Scale from "brAA-" to "brAA".