Eternit adopted International Financial Reporting Standards (IFRS) in 2007. The information presented in this chapter should be read together with the audited Financial Statements and respective notes, which is available at www.eternit.com.br/ir or www.cvm.gov.br.
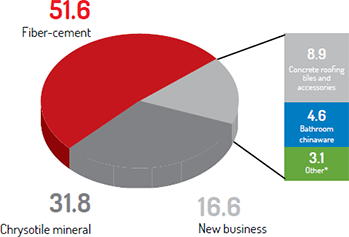
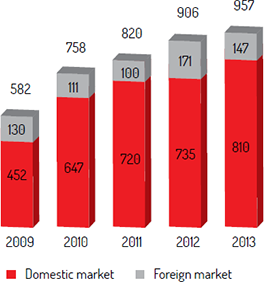
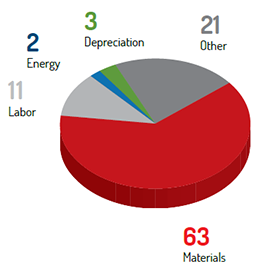
Consolidated net revenue amounted to R$957.3 million, increasing 5.6% from 2012. Domestic sales reached R$810.3 million in 2013, increasing 10.2% from 2012, driven by stronger demand for fiber-cement and chrysotile asbestos and by the effective sales policy. Export sales amounted to R$147.0 million, decreasing 14.0% from 2012, mainly due to the volume of chrysotile mineral sold but not shipped, which was partially offset by higher prices and by the 10.3% appreciation in the U.S. dollar against the Brazilian real (based on the average daily PTAX rate in the period).
Breakdown of consolidated net revenue (%) |
Consolidated net revenue (R$ million) |
|||
 |
 |
|||
| (*) Other: metal roofing tiles, polyethylene water tanks, toilet seats and metal bathroom fixtures, water pipe filters and construction solutions. |
||||
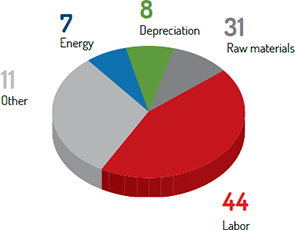
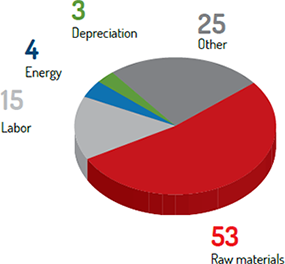
In 2013, consolidated cost of products sold amounted to R$575.9 million, increasing 13.0% from 2012, due to higher mining and production costs. As a result, gross margin contracted by 4 percentage points to end the period at 40%. The cost structure of fiber-cement, concrete roofing tiles and mining operations did not change significantly from 2012.
Mining (%) |
Concrete roofing tiles (%) |
Fiber-cement (%) |
|||
 |
 |
 |
|||
In 2013, the net financial expense amounted to R$1.0 million, compared to net financial income of R$2.2 million in 2012, with the main variations described below:
Financial expense: increase of 32.1% due to higher expenses with exchange variation, the adjustment to present value of suppliers and monetary restatement on the provisions for contingencies.
Financial income: increase of 21.9% driven by higher gains from exchange variation and the adjustment to present value of the client portfolio, which partially neutralized the lower gains from financial investments due to the reduction in the cash position.
| In R$ ‘000 | Accumulated 12 months | ||
|---|---|---|---|
| 2013 | 2012 | Change % | |
| Financial expenses | (48,553) | (36,757) | 32.1 |
| Financial income | 47,535 | 39,006 | 21.9 |
| Financial income (expense) | (1,018) | 2,249 | - |
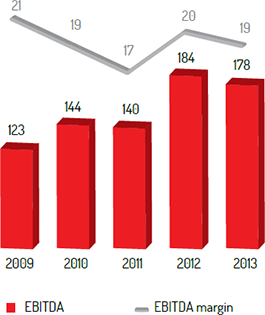
Consolidated EBITDA (earnings before interest, taxes, depreciation and amortization) in 2013 amounted to R$178.0 million, decreasing 3.4% from 2012. EBITDA margin stood at 19%, decreasing one percentage point from 2012, mainly due to the lower sales volume of chrysotile asbestos and concrete roofing tiles, coupled with the increase in cost of products sold, which outpaced the growth in consolidated net revenue.
Note that EBITDA is calculated in accordance with Instruction 527 issued by the Securities and Exchange Commission of Brazil (CVM) on October 4, 2012.
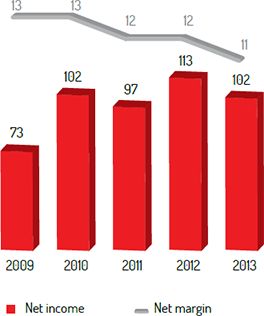
Eternit reported net income of R$102.3 million in 2013, down 9.5% from 2012, due to the same factors explained in the EBITDA section. Consequently, net margin decreased one percentage point to end 2013 at 11%.
The Company’s net debt ended the period at R$33.7 million. The gross debt of Eternit and its subsidiaries amounted to R$82.7 million, which is basically explained by: (i) the Advances on Export Contracts (ACE) for working capital; and (ii) the financing lines contracted for the acquisition of trucks, machinery and equipment for its operations under the programs Finimp (Import Financing) and Finame (Long-Term Financing for the acquisition and production of new machinery and equipment).
Cash, cash equivalents and short-term financial investments amounted to R$49.0 million, with financial investments remunerated at an average rate corresponding to 103% of the variation in the interbank overnight rate (CDI).
Eternit does not contract leveraged operations involving derivative instruments of any type that could be interpreted as speculative positions.
| Debt (R$ '000) | 2011 | 2012 | 2013 |
|---|---|---|---|
| Gross debt – short term | 40,553 | 55,839 | 56,881 |
| Gross debt – long term | 7,891 | 24,107 | 25,799 |
| Cash and cash equivalents | (42,333) | (16,656) | (13,295) |
| Short-term investments | (26,588) | (78,930) | (35,661) |
| Net debt | (20,477) | (15,640) | 33,724 |
| EBITDA | 140,107 | 184,326 | 178,036 |
| Net debt/EBITDA | (0.15) | (0.08) | 0.19 |
| Net debt/Equity (%) | - | - | 6.7 |
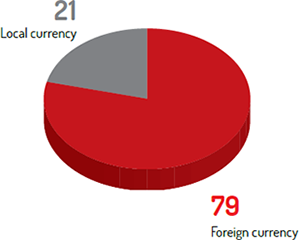
Debt by currency (%) |
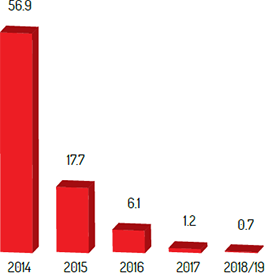
Debt amortization schedule (R$ million) |
|||
 |
 |
|||
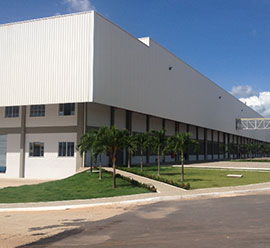
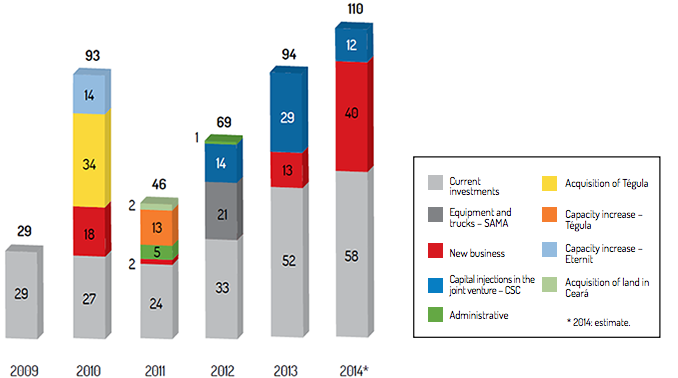
In accordance with its Structured Expansion and Diversification Plan, the Company’s investment in 2013 continued to focus on capturing productivity gains and on the construction of the bathroom chinaware plant and of the unit to research, develop and produce construction material inputs in Manaus, state of Amazonas.
In 2013, investments amounted to R$93.6 million, increasing 34.9% from the prior-year period, and were allocated as follows: (i) R$29.2 million to the construction of the bathroom chinaware plant; (ii) R$12.7 million to the construction of the unit to research, develop and produce construction material inputs in Manaus, state of Amazonas; and (iii) R$51.7 million to maintain and modernize the industrial facilities.
For 2014, investment is expected to amount to approximately R$109.9 million, with R$57.5 million allocated to maintaining and modernizing the industrial facilities, R$40.0 million to the construction of the unit to research, develop and produce construction material inputs in Manaus, state of Amazonas, and R$12.4 million for the construction of the bathroom chinaware plant.
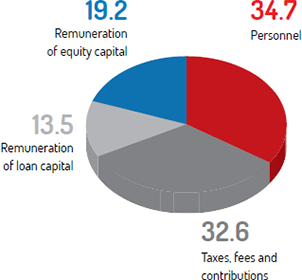
Value added in the year amounted to R$531.7 million, virtually stable in relation to 2012. Of this amount, 34.7% was allocated to employees and 32.6% to the federal, state and municipal governments in the form of taxes and contributions. Shareholders received 19.2% of the value added, while 13.5% went towards the remuneration of loan capital.
| Statement of Value Added (R$ ‘000) | Consolidated | ||||
|---|---|---|---|---|---|
| 2013 | 2012 | 2011 | 2010 | 2009 | |
| Revenues | 1,265,854 | 1,207,617 | 1,080,020 | 1,010,679 | 759,675 |
| Sales of goods, products and services | 1,219,671 | 1,159,627 | 1,071,780 | 991,302 | 743,393 |
| Other income | 47,128 | 48,955 | 6,454 | 8,442 | 8,502 |
| Revenue from the construction of own assets | - | - | 2,195 | 13,188 | 8,843 |
| Allowance for doubtful accounts on accounts receivable | (945) | (965) | (409) | (2,253) | (1,063) |
| Inputs acquired from third parties | (752,811) | (696,248) | (635,379) | (595,454) | (442,151) |
| Cost of sales | (545,593) | (523,053) | (465,104) | (389,845) | (236,156) |
| Material, electric energy, outsourced services and other | (194,915) | (161,998) | (159,859) | (192,097) | (200,007) |
| Loss/recovery of asset value | (7,541) | (7,271) | (9,363) | (7,736) | (5,319) |
| Other discounts, rebates and donations | (4,762) | (3,926) | (1,053) | (5,776) | (669) |
| Gross value added | 513,043 | 511,369 | 444,641 | 415,225 | 317,524 |
| Depreciation, amortization and depletion | (34,789) | (28,773) | (22,806) | (18,154) | (17,991) |
| Net value added generated by the Company | 478,254 | 482,596 | 421,835 | 397,071 | 299,533 |
| Value added received in transfer | 53,476 | 46,023 | 40,301 | 33,617 | 23,245 |
| Equity pickup | (6,223) | (531) | - | - | - |
| Financial income | 47,535 | 39,006 | 43,659 | 32,400 | 18,364 |
| Other | 12,164 | 7,548 | (3,358) | 1,217 | 4,881 |
| Total value added to be distributed | 531,730 | 528,619 | 462,136 | 430,688 | 322,778 |
| Distribution of value added | 531,730 | 528,619 | 462,136 | 430,688 | 322,778 |
| Personnel | 184,431 | 175,636 | 158,710 | 150,208 | 105,644 |
| Direct compensation | 115,990 | 112,991 | 105,313 | 94,054 | 67,272 |
| Benefits | 57,793 | 53,571 | 44,490 | 49,539 | 33,147 |
| Unemployment Compensation Fund (FGTS) | 10,648 | 9,074 | 8,907 | 6,615 | 5,225 |
| Taxes, charges and contributions | 173,547 | 172,130 | 170,303 | 151,060 | 116,937 |
| Federal | 125,006 | 123,215 | 122,919 | 110,047 | 91,751 |
| State | 46,460 | 47,603 | 46,129 | 39,878 | 23,987 |
| Local | 2,081 | 1,312 | 1,255 | 1,135 | 1,199 |
| Debt remuneration | 71,498 | 67,849 | 35,930 | 27,335 | 27,078 |
| Interest | 51,314 | 36,016 | 28,300 | 22,524 | 24,605 |
| Rental | 20,184 | 31,833 | 7,630 | 4,811 | 2,473 |
| Equity remuneration | 102,254 | 113,004 | 97,193 | 102,085 | 73,119 |
| Interest on equity | 22,726 | 24,068 | 23,620 | 22,367 | 40,203 |
| Dividends | 48,851 | 47,509 | 47,956 | 58,155 | 15,118 |
| Retained profit | 30,677 | 41,427 | 25,617 | 21,562 | 17,793 |
| Participation by minority shareholders | - | - | - | 1 | 5 |
The companies of the Eternit Group encourage the sustainable development of local communities and contribute to their economies through the payment of state value-added tax (ICMS). In exchange, they receive tax incentives for the investments made in their production units.
In 2014, the Company will focus its efforts on consolidating its investments in Fortaleza and in the unit to research, develop and produce construction material inputs in Manaus| Significant indirect economic impacts, including the extension of impacts - 2013 (R$) | ||||
|---|---|---|---|---|
| Units of the Eternit Group | State | Payment of ICMS tax |
Amount of Fund for Municipal Governments (FPM) | Contribution to municipal tax receipts (%) |
| Goiânia Plant | Goiás | 20,493,940 | 145,426,297 | 14.1 |
| Anápolis Plant | Goiás | 9,127,654 | 40,352,141 | 22.6 |
| Simões Filho Plant | Bahia | 14,398,336 | 17,660,348 | 81.5 |
| Rio de Janeiro Plant | Rio de Janeiro | 20,887,458 | 141,386,677 | 14.8 |
| Colombo Plant | Paraná | 19,195,743 | 39,871,439 | 48.1 |
| Tégula Atibaia Plant | São Paulo | 3,590,810 | 28,233,671 | 12.7 |
| Tégula Içara Plant | Santa Catarina | 864,712 | 14,846,515 | 5.8 |
| Tégula Camaçari Plant | Bahia | 375,925 | 57,875,095 | 0.6 |
| Tégula Frederico Westphalen Plant | Rio Grande do Sul | 532,713 | 11,072,744 | 4.8 |
| Tégula São José do Rio Preto Plant | São Paulo | 521,076 | 41,513,180 | 1.3 |
| Tégula Anápolis Plant | Goiás | 827,026 | 46,156,122 | 1.8 |
| Tégula Londrina Distribution Center | Paraná | 37,184 | 47,320,272 | 0.1 |
| SAMA | Goiás | 19,644,622 | 12,773,019 | 153.8 |
| Significant financial government assistance received (R$) | 2013 | 2012 | 2011 |
|---|---|---|---|
| Eternit + Precon | 17,137,787 | 12,979,188 | 12,771,725 |
| SAMA | 6,242,967 | 2,564,872 | None |
| Tégula | 647,442 | 1,124,112 | 1,296,376 |
| Total | 24,028,196 | 16,668,172 | 14,068,101 |
Brazil’s Central Bank projects moderate economic growth in 2014, with GDP growth of 2.3%. The construction industry is one of the main drivers of Brazil’s development, and the federal government has been increasing its investments in housing, basic sanitation and infrastructure. This scenario is likely to continue over the next few years, and in 2014, GDP in the construction industry is expected to grow by 2.6%, based on the forecast made by the Central Bank of Brazil.
For the construction materials industry, the Brazilian Association of Construction Materials Industry (ABRAMAT) projects growth of 4.5% in industry sales in relation to 2013, with a continuation of the federal government’s incentives for the construction industry and stability in income and employment levels and in credit availability.
Brazil suffers from a large housing deficit, which is estimated by the João Pinheiro Foundation at 6.9 million units, 70% of which is formed by households who live in precarious conditions and are burdened by excessively high rents and by the cohabitation of families. According to studies for the industry conducted by the U.S. consulting firm Booz Allen Hamilton, 77% of housing units produced in Brazil are built under a self-build regime, since 72% of this deficit is concentrated in households earning up to three minimum monthly wages in which the activity of contractors is very limited.
New job creation, better income distribution, increased financing, higher investments in infrastructure and more units built under the government’s My Home, My Life housing Program will help resolve the housing problem, while also having a positive impact on the Company’s business, given the stronger demand for our products targeting primarily self-build construction projects.
Supported by its Structured Expansion and Diversification Program, Eternit is preparing to become the most diversified construction materials manufacturer in Brazil. The first phase of this program consolidated Eternit as the country’s largest and most diversified roofing products manufacturer in 2010, and its capacity to innovate and develop competitive advantages has enabled it to double its revenue. The Company is now embarking on a new growth cycle, supported by the strength of its brand and the broad reach of its distribution network, starting with the inauguration of its new bathroom chinaware plant.
These aspects, combined with the higher purchasing power of consumers, point to stronger demand for the products sold by Eternit in 2014. With an efficient capital structure, low debt and regular investments, the Company will focus its efforts on consolidating its investments in the city of Fortaleza and in the unit to research, develop and produce construction material inputs in the city of Manaus. Due to the evolution in the economic scenario, the Company could focus on organic growth to expand the production capacity of its fiber-cement line and pursue opportunities to acquire construction material manufacturers.
In this context, however, it is important to take into account the current scenario of the Brazilian economy, which is marked by factors such as weak GDP growth; the low competitiveness of the country’s manufacturing industry due to infrastructure bottlenecks and the stronger local currency; as well as the new challenges that could impact investment projects in the country, new job creation and income distribution, which include a new wave of street protests, the World Cup and the presidential and gubernatorial elections. Regardless of the challenges that lie ahead, Eternit believes in the continued growth of the Brazilian economy, especially in its industry.