G4-DMA Economic Performance
Our economic-financial performance is underpinned by a management decision making process based on generating sustainable long-term results with the best risk return ratio.
We track our main performance indicators, such as Operational Efficiency Ratio (ER), Return On Average Equity (ROAE), Coverage of Operational Expenses, Return on Average Assets and those related to Insurance, Private Pension and Capitalization activities. The results, which have been robust and aligned with our strategic goals, are disclosed to the market on a quarterly basis by means of our Economic and Financial Analysis Report.
Generating Sustainable Results and the Best Risk Return Ratio Are the Main Priorities In Defining Our Strategy
We are committed to the interests of our clients and shareholders and to the country's social and economic growth. This involves the provision of efficient, quality banking and insurance services, based on best corporate governance practices with a focus on consistent results. Our future vision encompasses improving our position among private institutions. This is aligned with the acquisition of HSBC Brasil S.A., which drove significant growth in the client base and capillarity.
We face the constant market challenges with determination, we stimulate investment and the opening up of credit, we expand our offer of products, services and solution, as well as promoting banking inclusion and social mobility by means of our extensive service network.
We will maintain this course in 2017 with the expansion of our loan portfolio, focused on financing consumption, with an emphasis on payroll deductible loans and housing finance, as well as boosting our activities in the insurance segment. To do this, we will maintain effective security criteria, which include rigorous assessment in credit concession processes and the continuous collection of amounts overdue with credit recovery programs and control over claims in insurance activities.
Just as important for our strategy is business related to investment banking and corporate, private banking, third-party asset management (BRAM), cards and consortia. Overseas, we are present in strategic markets, providing support for Brazilian companies, clients resident outside the country and foreign companies interested in Brazil. Bradesco Securities, with operations in New York, London and Hong Kong, is fundamental in raising funding and distributing securities in these financial centers, as is Banco Bradesco Europa, located in Luxemburg and London, which provides finance services for corporate clients and private banking services.
We adopt a cautious approach in all markets. In the decision making process for granting loans to finance clients' projects, we assess and monitor social and environmental factors, including those related to climate change. In specific cases, we adopt the Equator Principles guidelines. With the adoption of the 2012 version of the International Finance Corporation's (IFC) performance standards, we require that projects classified under the Equator Principles and that have projected carbon emissions in excess of 25,000 metric tons per year perform emissions inventories and study financially viable alternatives for reducing or offsetting emissions.
In investment analysis, through Bradesco Asset Management (BRAM) we adopt a positive triage process for the funds with environmental, social and corporate governance criteria. Since 2013, BRAM has been developing a project to drive the simultaneous integration of the Principles for Responsible Investment (PRI) throughout its management activities.
We consider corporate social and environmental actions to be any investment that benefits society, because our objective is to drive convergence between business goals and the wishes and interests of the communities in the regions in which we operate. Projects are subjected to an approval flow that identifies those capable of promoting social transformation and environmental preservation. Our Corporate Social and Environmental Investment Standard contributes to this to the extent that it provides guidelines and orientation on investments and support for social and environmental projects. Our Sustainability Policy addresses best practices that drive economic performance. Our Social and Environmental Responsibility Standard complements this with the directive of "providing added value for shareholders through financial results through businesses that adopt social, environmental and corporate governance criteria aligned with long-term interests".
G4-DMA Economic Performance
Our pursuit of growth implies substantial investments in infrastructure, information technology (IT) and the Human Resources area – indispensable pillars for the banking and insurance markets. In 2016, we invested R$6.5 billion on innovating, updating and maintaining our IT environment to ensure the implementation of the best practices and technologies in existence, and we invested another R$143.6 million in training programs for staff through the Bradesco Corporate University (UniBrad) with a view to promoting motivation, innovation and client focus.
Regarding clients and shareholders, social and environmental responsibility, security and credibility are integral to our business culture, and three broader fronts underpin our strategic planning:
a. Growing organically, without losing sight of the possibility of acquisitions, associations and partnerships, as long as these are aligned with service quality, product, solution and service security and with the effective improvement of operational and financial efficiency ratios.
b. Maintaining rigorous controls to identify, assess and mitigate risks in our activities, as well as defining the acceptable levels for each operation.
c. Doing business with total transparency, ethical conduct and appropriate remuneration for shareholders.
To provide the market with an outlook on future performance of our main revenues and expenses in 2017, with the disclosure of our 2016 results we presented a guidance, subject to risks and uncertainties, since it is based on management assumptions and on information available on the date they were published: February 2nd, 2017.
The macroeconomic conjuncture, sector policies and the regulatory framework have an important impact on our operations. In recent years, deceleration in the growth of Gross Domestic Product (GDP) led to moderation in the expansion of credit and an increase in the level of delinquency, while the increase in the basic interest rate boosted the cost of raising funds in banking intermediation activities. However, the macroeconomic adjustments proposed by the new government have been helping to raise the confidence of families and the business community, driving the prospect of stabilization and economic growth in 2017 and even more so in 2018, which will also be favored by the decreases in the basic interest rate.
The banking sector is subject to intense regulation and consequently suffers the influence of alterations in different dimensions. In recent years, examples of this have been the macroprudential measures which altered the capital requirements for financing vehicles; the changes in taxes on financial operations (IOF) for the concession of loans and for external fund raising; the change in the rules for the remuneration of savings accounts; interest rates and maximum terms for payroll loans; rules on sharing credit card transaction systems; and changes in the liabilities and remuneration of mandatory deposits. The most important, however, was the application of Basel III, which modifies a set of measures relative to capital, risk control and liquidity requirements, among others. In this context, we have demonstrated our capacity and readiness to guarantee adherence to the regulatory environment.
MAIN FINANCIAL INDICATORS
G4-9 | G4-EC1
| HIGHLIGHTS |
2013 |
2014 |
2015 |
2016 |
Variation (%) |
| 2016 x 2013 |
2016 x 2015 |
| Adjusted income statement for the period (R$ million)1 |
| Book net income |
12,011 |
15,089 |
17,190 |
15,084 |
25.6 |
(12.3) |
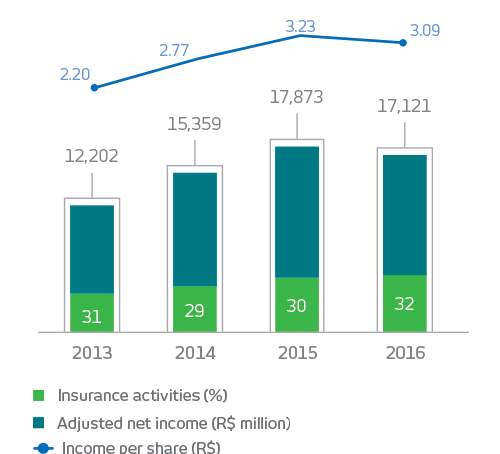
| Adjusted net income |
12,202 |
15,359 |
17,873 |
17,121 |
40.3 |
(4.2) |
| Total net interest income |
43,286 |
48,295 |
55,387 |
62,454 |
44.3 |
12.8 |
| Gross credit margin |
35,127 |
38,366 |
42,788 |
49,897 |
42.0 |
16.6 |
| Net credit margin |
23,082 |
25,709 |
27,614 |
28,158 |
22.0 |
2.0 |
| Provision for loan losses |
(12,045) |
(12,657) |
(15,174) |
(21,739) |
80.5 |
43.3 |
| Fee and commission income |
19,786 |
22,089 |
24,839 |
28,024 |
41.6 |
12.8 |
| Administrative and personnel expenses |
(27,573) |
(28,815) |
(31,038) |
(36,771) |
33.4 |
18.5 |
Insurance written premiums, pension plan contributions
and capitalization bond income |
49,752 |
56,152 |
64,612 |
71,419 |
43.6 |
10.5 |
| Statement of financial position (R$ million)1 |
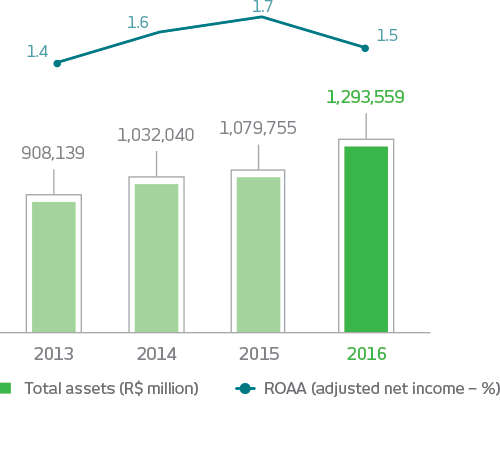
| Total assets1 |
908,139 |
1,032,040 |
1,079,755 |
1,293,559 |
42.4 |
19.8 |
| Securities |
313,327 |
346,358 |
407,584 |
549,873 |
75.5 |
34.9 |
| Loan operations2 |
427,273 |
455,127 |
474,027 |
514,990 |
20.5 |
8.6 |
| - Individual |
130,750 |
141,432 |
147,749 |
172,045 |
31.6 |
16.4 |
| - Corporate |
296,523 |
313,695 |
326,278 |
342,945 |
15.7 |
5.1 |
| Allowance for Loan Losses (ALL)3 |
(21,687) |
(23,146) |
(29,499) |
(40,714) |
87.7 |
38.0 |
| Total deposits |
218,063 |
211,612 |
195,760 |
234,214 |
7.4 |
19.6 |
| Technical reserves |
136,229 |
153,267 |
177,835 |
223,342 |
63.9 |
25.6 |
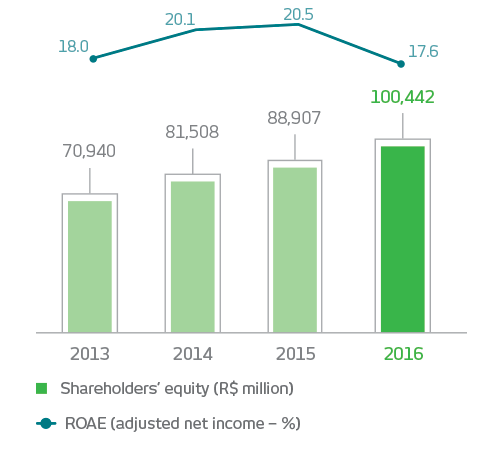
| Shareholders' equity |
70,940 |
81,508 |
88,907 |
100,442 |
41.6 |
13.0 |
| Assets under management |
1,260,056 |
1,426,099 |
1,510,396 |
1,904,912 |
51.2 |
26.1 |
| Performance indicators for adjusted net income (% unless otherwise indicated) |
| Adjusted net income per share (R$)4 |
2.20 |
2.77 |
3.23 |
3.09 |
40.5 |
(4.3) |
| Book value per share (common and preferred – R$)4 |
12.81 |
14.72 |
16.07 |
18.16 |
41.8 |
13.0 |
| Return on average equity5, 6 |
18.0 |
20.1 |
20.5 |
17.6 |
(0.4) p.p |
(2.9) p.p |
| Annualized return on average assets6 |
1.4 |
1.6 |
1.7 |
1.5 |
0.1 p.p |
(0.2) p.p |
| Average rate 12 months (adjusted net interest income/total average assets – repos – permanent assets) |
7.0 |
7.3 |
7.5 |
7.5 |
0.5 p.p |
- |
| Fixed assets ratio7 |
45.4 |
47.2 |
35.2 |
44.8 |
(0.6) p.p |
9.6 p.p |
| Combined ratio – Insurance8 |
86.1 |
86.1 |
86.7 |
88.0 |
1.9 p.p |
1.3 p.p |
| Operating efficiency ratio (ER) |
42.1 |
39.2 |
37.5 |
39.5 |
(2.6) p.p |
2.0 p.p |
| Coverage ratio (fee and commission income/administrative and personnel expenses) |
71.8 |
76.7 |
80.0 |
76.2 |
4.4 p.p |
(3.8) p.p |
| Basel ratio – total7, 9 |
16.6 |
16.5 |
16.8 |
15.4 |
(1.2) p.p |
(1.4) p.p |
| Market capitalization (R$ million)10 |
128,085 |
145,536 |
100,044 |
160,813 |
25.6 |
60.7 |
| Loan portfolio quality (%)11 |
| ALL/loan portfolio3 |
6.7 |
6.7 |
8.0 |
10.4 |
3.7 p.p |
2.4 p.p |
| Non-performing loans (> 60 days12/loan portfolio) |
4.2 |
4.3 |
5.0 |
6.5 |
2.3 p.p |
1.5 p.p |
| Delinquency ratio (> 90 days12/loan portfolio) |
3.5 |
3.5 |
4.1 |
5.5 |
2.0 p.p |
1.4 p.p |
| Coverage ratio (> 90 days12)3 |
192.3 |
189.0 |
198.0 |
188.4 |
(3.9) p.p |
(9.6) p.p |
| Coverage ratio (> 60 days12)3 |
158.9 |
156.6 |
161.7 |
158.8 |
(0.1) p.p |
(2.9) p.p |
| Other information |
|
|
|
|
|
|
| Employees13 |
100,489 |
95,520 |
92,861 |
108,793 |
8.3 |
17.2 |
| Outsourced employees and interns |
12,614 |
12,916 |
13,223 |
16,702 |
32.4 |
26.3 |
| Branches |
4,674 |
4,659 |
4,507 |
5,314 |
13.7 |
17.9 |
| PAs14 |
3,586 |
3,486 |
3,511 |
3,821 |
6.6 |
8.8 |
| PAEs14 |
1,180 |
1,145 |
736 |
1,013 |
(14.2) |
37.6 |
| External ATM network points – Bradesco15, 16 |
3,003 |
1,344 |
627 |
186 |
(93.8) |
(70.3) |
| Banco24Horas network points15 |
11,583 |
12,450 |
11,721 |
10,972 |
(5.3) |
(6.4) |
| Bradesco Expresso (correspondent banks) |
46,851 |
50,006 |
43,560 |
38,430 |
(18.0) |
(11.8) |
| ATMs (Bradesco and Banco24Horas networks) |
48,203 |
48,682 |
50,467 |
56,110 |
16.4 |
11.2 |
| Active checking account holders (million)17, 18 |
26.4 |
26.5 |
26.0 |
26.8 |
1.5 |
3.1 |
| Savings account holders (million)19 |
50.9 |
59.1 |
60.1 |
62.1 |
22.0 |
3.3 |
1. For further information please refer to explanatory note 5 – Statement of Financial Position and Statement of Managerial Income for year ended on December 31, 2016.
2. Expanded loan portfolio, includes sureties and guarantees, letters of credit, advances of credit card receivables, co-obligation of loan assignments (FIDC – credit right investment funds and CRI – certificates of real estate receivables), co-obligation of rural loan assignments and operations involving credit risk – commercial portfolio, including debentures and promissory note transactions.
3. Includes provision for guarantees provided, encompassing sureties, guarantees, letters of credit, and standby letters of credit, comprising the concept of excessive ALL.
4. For purposes of comparison, shares were adjusted in accordance with bonuses and share splits.
5. Excluding mark-to-market effect of Available-for-Sale Securities recorded under Shareholders' Equity.
6. Adjusted net income.
7. From March 2015, considers the ratio calculated based on prudential consolidated in accordance with CMN Resolution no. 4,192/13. It should be noted that the prudential consolidated is calculated in line with the regulatory guidelines of CMN Resolution no. 4,280/13.
8. Excludes additional provisions.
9. From October 2013, the calculation of the Basel ratio is in accordance with the regulatory guidelines of CMN resolutions no. 4,192/13 and no. 4,193/13 (Basel III).
10. Number of shares (excluding treasury shares) multiplied by the closing price for common and preferred shares on the last trading day in the period.
11. Concept defined by the Brazilian Central Bank (Bacen).
12. Overdue loans.
13. In 2016, includes 21,016 HSBC Brasil employees; and in 2014, includes the transfer of 2,431 Scopus Tecnologia employees to IBM Brasil.
14. PAs (Service branches): resulting from the consolidation of Bank Service branches (PAB), Advanced Service Points (PAA) and exchange branches, in accordance with CMN Resolution no. 4,072/12; and in-company ATMs (PAE): points located in company with electronic service.
15. Includes points shared between the Bradesco network and the Banco24Horas network.
16. The reduction was due to the sharing of external network ATMs by the Banco24Horas Network ATMs.
17. Number of single clients (individual and corporate).
18. Refers to the first and second checking account holders.
19. Number of accounts.
STATEMENT OF INCOME
G4-9 | G4-EC1
| R$ million |
2013 |
2014 |
2015 |
2016 |
Variation (%) |
| 2016 x 2013 |
2016 x 2015 |
| Net interest income |
43,286 |
48,295 |
55,387 |
62,454 |
44.3 |
12.8 |
| - Interest earning portion |
42,389 |
47,497 |
54,777 |
63,059 |
48.8 |
15.1 |
| - Non-interest earning portion |
897 |
798 |
610 |
659 |
(26.5) |
8.0 |
| - Impairment of financial assets |
- |
- |
- |
(1,264) |
- |
- |
| Provision of loan losses (PLL) |
(12,045) |
(12,657) |
(15,174) |
(21,739) |
80.5 |
43.3 |
| Gross income from financial intermediation |
31,241 |
35,638 |
40,213 |
40,715 |
30.3 |
1.2 |
| Income from insurance premiums, pension plans and capitalization bonds, net of variation in technical reserves, retained claims and others* |
4,471 |
5,047 |
5,426 |
5,669 |
26.8 |
4.5 |
| Fee and commission income |
19,786 |
22,089 |
24,839 |
28,024 |
41.6 |
12.8 |
| Personnel expenses |
(13,061) |
(13,967) |
(14,699) |
(17,637) |
35.0 |
20.0 |
| Other administrative expenses |
(14,512) |
(14,848) |
(16,339) |
(19,134) |
31.8 |
17.1 |
| Tax expenses |
(4,381) |
(4,627) |
(5,640) |
(6,048) |
38.1 |
7.2 |
| Equity in the earnings (losses) of unconsolidated companies |
43 |
187 |
144 |
218 |
407.0 |
51.4 |
| Other operating income/(expenses) |
(4,743) |
(5,395) |
(6,708) |
(7,015) |
47.9 |
4.6 |
| Operating result |
18,844 |
24,124 |
27,236 |
24,792 |
31.6 |
(9.0) |
| Non-operating results |
(120) |
(183) |
(283) |
(180) |
50.0 |
(36.4) |
| Income tax/Social Contribution |
(6,425) |
(8,469) |
(8,933) |
(7,338) |
14.2 |
(17.9) |
| Non-controlling interest |
(97) |
(113) |
(147) |
(153) |
57.7 |
4.1 |
| Adjusted net income |
12,202 |
15,359 |
17,873 |
17,121 |
40.3 |
(4.2) |
* "Others", includes: draws and redemption of capitalization bonds and expenses with sales of insurance, pension plans and capitalization bonds.
NON-RECURRING EVENTS
The following table presents a comparison between the main non-recurring events that impacted book net income.
| Book Net Income X Adjusted Net Income (R$ million) |
2013 |
2014 |
2015 |
2016 |
| Book Net Income |
12,011 |
15,089 |
17,190 |
15,084 |
| Non-recurring events (net of tax effects) |
191 |
270 |
683 |
2,037 |
| Tax credit |
(462) |
- |
(2,341) |
- |
| Technical reserves1 |
(1,471) |
(432) |
(276) |
592 |
| Excessive ALL/worsening of rating/drag (HSBC Brasil) |
- |
- |
2,222 |
716 |
| Asset Impairment2 |
451 |
800 |
472 |
214 |
| Contingent liabilities3 |
58 |
(98) |
606 |
(266) |
| Law no. 12,865/13 (REFIS) |
(1,950) |
- |
- |
- |
| Rate adjustment at market value – NTNs |
3,565 |
- |
- |
- |
| Amortization of goodwill |
- |
- |
- |
577 |
| Single salary bonus |
- |
- |
- |
191 |
| Others4 |
- |
- |
- |
13 |
| Adjusted net income |
12,202 |
15,359 |
17,873 |
17,121 |
1. In 2016, this refers basically to the constitution of: (i) provision for insufficient premiums; and (ii) provision for claims occurred and not informed (IBNR), both referring to the Health segment.
2. Refers basically to the impairment of: (i) shares in the amount of R$77 million (2015 – R$238 million; 2014 – R$749 million; 2013 – R$361 million); and (ii) other permanent/intangible assets amounting to R$137 million (2015 – R$234 million; 2014 – R$51 million; 2013 – R$90 million).
3. In 2016 and 2015, this refers in great part: (i) to the reversal of contingent liabilities relative to social security contributions (INSS) on remuneration paid to freelance service providers (doctors), due to the favorable decision in the Higher Court and in the Federal Supreme Court in the third quarter of 2016, amounting to R$595 million; and (ii) to the constitution of a provision for contingent liabilities arising from loan obligations – FCVS, amounting to R$235 million in 2016 (2015 – R$307 million).
4. In 2016, this refers: (i) to the gain from the partial divestment of investments amounting to R$91 million; and (ii) other non-recurring expenses, such as costs incurred with the migration/incorporation of HSBC Brasil, amounting to R$104 million.
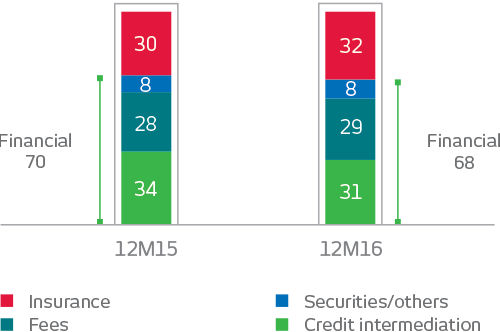
INCOME ORIGINATION
In its daily operations, we strive to maintain a balance, with different businesses and sources of income as a means of diversifying the risks inherent to its activities. It operates mainly on two fronts: in the banking/financial area and in insurance, supplementary pension plans and capitalization bonds. They account respectively for 68% and 32% of the our income. This ensures a secure diffusion of income, encompassing loans, investments, asset management, corporate and private banking, cards, consortia, insurance, supplementary pensions, capitalization bonds and others. The following charts show the breakdown of our net income.
(%)
NET INCOME AND PROFITABILITY
Shareholders' equity totaled R$100,442 million in December 2016, growing 13.0% over 2015. The return on average equity (ROAE) was 17.6% at the end of the period.
Adjusted net income for the period was
R$17,121 million (a reduction of 4.2% compared
with the adjusted net income of
R$17,873 million in 2015), corresponding to
R$3.09 per share.
Total assets reached R$1.294 trillion, an increase
of 19.8% over the previous year, driven
by the higher business volume and by the consolidation of HSBC Brasil from the third
quarter of 2016. The return on average assets
(ROAA) was 1.5%.
VALUE ADDED STATEMENT
The added value represents how much wealth we produce and how this wealth is distributed in society year on year. Worthy of note is the growth in added value for shareholders and in remuneration of work.
At the end of 2016, added value totaled R$48,144 million, up 2.1% over the previous year. Of this amount: (i) R$15,555 million, or 32.3%, went to the government in the form of contributions, taxes and fees; (ii) R$15,468 million, or 32.1%, corresponded to employee remuneration; (iii) R$10,145 million, or 21.1%, was reinvested in the business; and (iv) R$6,976 million, or 14.5%, was distributed to the shareholders as interest on own equity.
(R$ MILLION)

G4-EC1
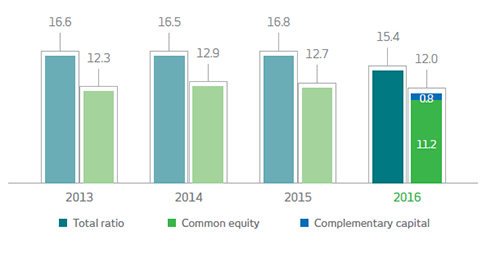
BASEL RATIO – BASEL III
Our capital structure is compliant with Basel III requirements, ensuring that management is better positioned to achieve strategic targets and inspire trust and peace of mind for shareholders and investors.
At the end of the year, Reference Equity totaled R$101,127 million, compared with risk weighted assets of R$656,189 million. The total Basel ratio reached 15.4%, 10.5% above the required by the Brazil’s Central Bank (Bacen), and Tier I Capital reached 12.0%, a 0.7 percentage point reduction compared with December 2015, impacted basically: (i) by the effect of the consolidation of HSBC Brasil, which influenced (a) the weighted assets, (b) goodwill/intangible assets (c) the other prudential adjustments, which were also impacted by the alteration of the application of the adjustment factor in accordance with CMN Resolution no. 4,192/13, which increased from 40% in January 2015 to 60% from January 2016; and partially offset: (ii) by the issuance of subordinate debt, authorized by the Central Bank in November 2016 to make up Tier I/ Complementary Capital amounting to R$5.0 billion.
(%)
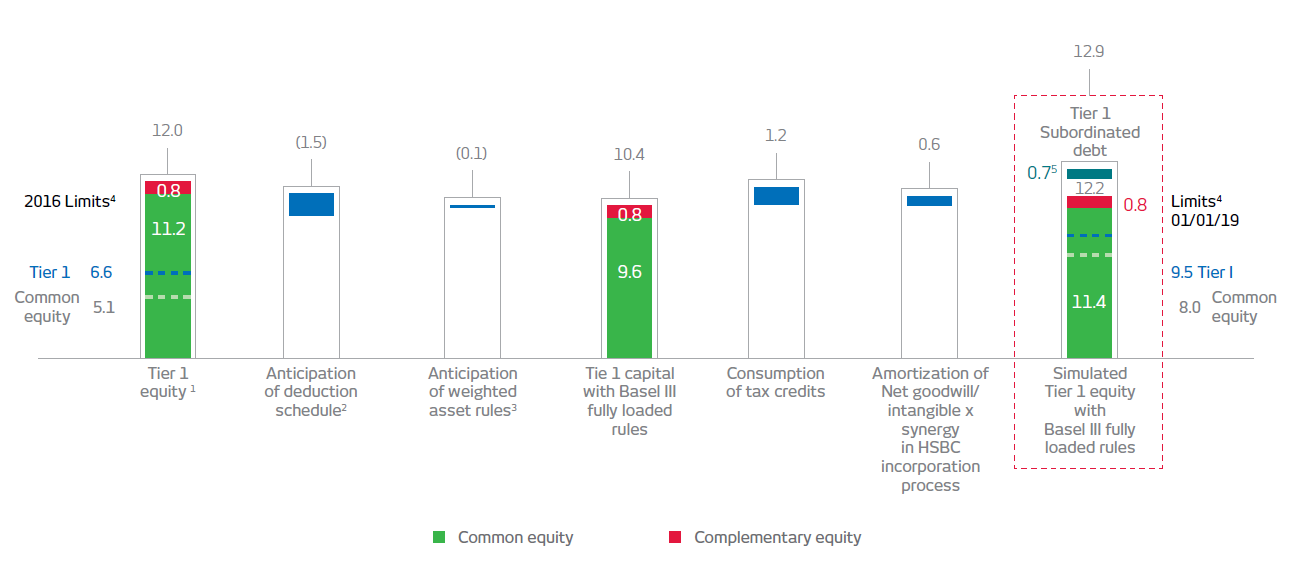
FULL IMPACT – BASEL III
There follows a simulation for Basel III, considering some of the main future adjustments, which include: (i) the application of 100% of the deductions in the implantation schedule; (ii) the reallocation of funds by payment of dividends by the insurance business; (iii) the application of tax credits; (iv) the anticipation of the multiplier of portions of market and operational risk, from 9.875% to 8% and the impact of CMN Resolution no. 4,517/16; and (v) the impact of the acquisition of HSBC Brasil (amortization of goodwill/intangible assets and synergy in the incorporation process), resulting in a common equity ratio of 12.2% which, with potential funding via subordinate debt, may total a Tier 1 Basel ratio of approximately 12.9% at the end of 2018.
(%)
|
|
|
Capital principal |
Capital
complementar |
|
Subtotal |
|
Total |
|
|
Limites4 |
2016 |
- |
- |
- |
- |
- |
- |
01/01/19 |
|
Nível I |
6,6 |
- |
- |
- |
- |
- |
- |
9,5 |
|
Capital principal |
5,1 |
- |
- |
- |
- |
- |
- |
8,0 |
|
Capital nível I1 |
- |
11,2 |
0,8 |
- |
- |
- |
12,0 |
- |
|
Antecipação do cronograma de deduções2 |
- |
- |
- |
- |
- |
- |
(1,5) |
- |
|
Antecipação das regras de ativos ponderados3 |
- |
- |
- |
- |
- |
- |
(0,1) |
- |
|
Capital nível I com regras integrais de Basileia III |
- |
9,6 |
0,8 |
- |
- |
- |
10,4 |
- |
|
Consumo de crédito tributário |
- |
- |
- |
- |
- |
- |
1,2 |
- |
|
Ágio/intangível líquido de amortização x Ganho de sinergia no processo de incorporação do HSBC Brasil |
- |
- |
- |
- |
- |
- |
0,6 |
- |
| Nível I – Dívida subordinada |
Capital nível I simulado com regras integrais de Basileia III |
- |
11,4 |
0,8 |
- |
12,2 |
0,75 |
12,9 |
- |
1. Published (Schedule 60%).
2. Effect of full impact. Includes the stock of goodwill/intangible paid for in the purchase of HSBC Brasil, net of amortizations and reallocation of funds, via payment of Bradesco Seguros Group dividends.
3. Considers the anticipation of the multiplier of portions of market and operational risk, from 9.875% to 8% in 2019, and the change in rules for the consolidation of proportional companies in accordance with CMN Resolution No. 4,517/16.
4. Refers to the required minimums in accordance with the Bacen communications No. 3,768/15 and 3,769/15. It should be noted that Bacen established the counter-cyclical portion of equity required at 0%, which may reach 2.5% by 2019, and includes 1% for the systemic importance portion in 2019.
5. Considers the possibility of management issuing complementary equity by 2018, if market conditions permit this.
CAPITAL BUFFER MARGIN
In 2016, the financial margin reached R$62,454 million, growing by R$7,067 million or 12.8%, compared with 2015, reflecting growth in operational earnings: (i) yielding interest of R$8,282 million, worthy of note being loan intermediation driven in part by the consolidation of HSBC Brasil from the third quarter of 2016; (ii) non-interest earning portion of R$49 million; offset: (iii) by the effect of losses from the impairment of financial assets (previously stated as shareholders' equity) amounting to R$1,264 million.
In 2016, the net interest margin on loans varied 2.0% compared with 2015, due basically: (i) to the increase in the (a) average spread and (b) the average volume of business, justified in part by the consolidation of HSBC Brasil from the third quarter; offset: (ii) by the increase in delinquency, due particularly to the intensification of the deceleration in economic activity in the period; and (iii) by the impact produced by the effect of aligning the level of provisioning for determined operations with corporate clients during the first half of 2016, worthy of note being one specific case whose demotion to an H rating produced an impact of R$1,201 million.
(R$ Million, Unless otherwise Indicated)
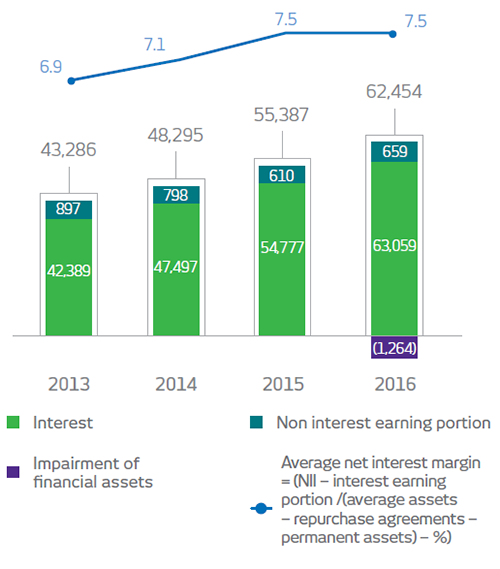
INTEREST EARNING PORTION OF NET CREDIT INTERMEDIATION
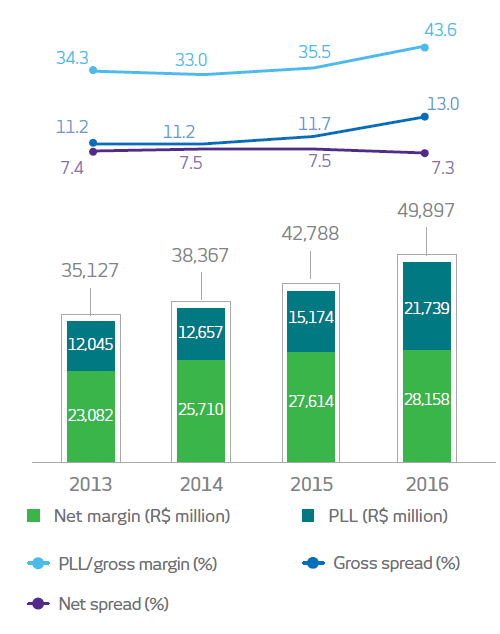
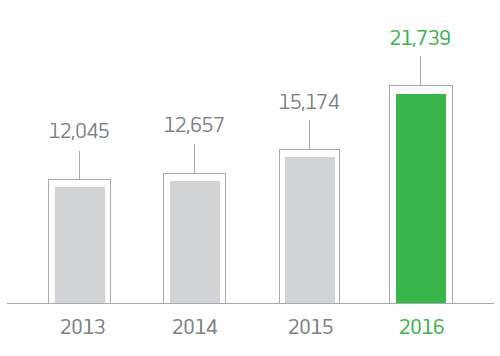
EXPENSES WITH PROVISION FOR LOAN LOSSES
In 2016, the expenses from the provision for loan losses totaled R$21,739 million, a variation of 43.3%, or R$6,565 million, compared with the previous year, due in great part: (i) to the increase in delinquency, impacted mainly by the intensification of the deceleration in economic activity in the period; (ii) to the impact produced by the effect of aligning the level of provisioning for operations with corporate clients, worthy of note being one specific case whose worsened rating produced an impact of R$1,201 million in the first half of the year; and (iii) the effect of the consolidation of HSBC Brasil from the third quarter of 2016.
The reinforcement of the policy and loan concession processes, the quality of the guarantees obtained and the improvement of loan recovery processes mitigated the effects of the growth in delinquency.
(R$ Million)
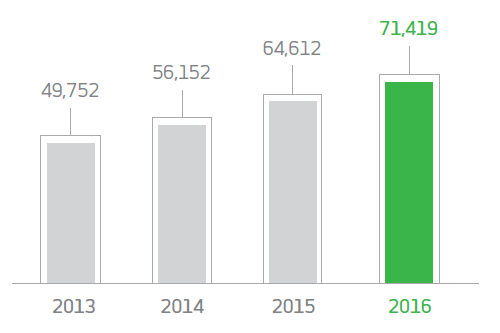
INSURANCE WRITTEN PREMIUMS, PENSION PLAN CONTRIBUTIONS AND CAPITALIZATION BOND INCOME
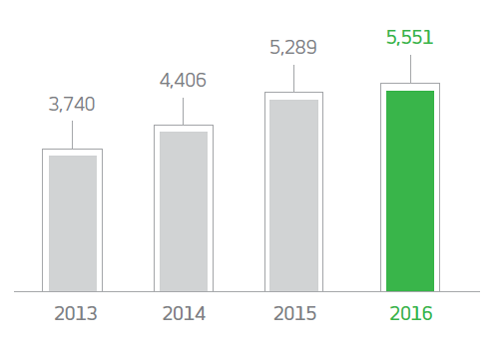
The Bradesco Seguros Group is one of our main sources of earnings, showing resilience even in more volatile years. Net income in 2016 was R$5.551 billion, 5.0% up on the previous year due: (i) to a 10.5% increase in revenue; (ii) the increase in financial and asset income; (iii) the 0.4 percentage point decrease in the commercialization rate; (iv) the improvement in the administrative efficiency ratio, even taking into account the category's collective agreement in January; offset in part: (v) by the 2.7 percentage point increase in the claim rate; (vi) by the effect of the R$101.9 million from the review of the extended guarantee operation business plan; and (vii) by the effect of the increase in the Social Contribution (CSLL) rate.
Revenue from insurance written premiums, pension plan contributions and capitalization bonds reached R$71.419 billion, growing 10.5% compared with 2015, influenced by Health, Life, Pension Plan and Capitalization products, which grew 14.7%, 10.7%, and 6.5% respectively. Technical reserves reached R$223.342 billion, growing 25.6% in the period.
Net Income (r$ Million)
INSURANCE WRITTEN PREMIUMS, PENSION PLAN CONTRIBUTIONS AND CAPITALIZATION BOND INCOME (R$ MILLION)
| R$ million (unless otherwise stated) |
2013 |
2014 |
2015 |
2016 |
Variation (%) |
| 2016 x 2013 |
2016 x 2015 |
| Net income |
3,740 |
4,406 |
5,289 |
5,551 |
48.4 |
5.0 |
| Insurance written premiums, pension plan contributions and capitalization bond income |
49,752 |
56,152 |
64,612 |
71,419 |
43.6 |
10.5 |
| Technical reserves |
136,229 |
153,267 |
177,835 |
223,342 |
63.9 |
25.6 |
| Financial assets |
146,064 |
166,022 |
191,921 |
242,063 |
65.7 |
26.1 |
| Claims ratio (%) |
71.2 |
71.0 |
72.0 |
74.7 |
3.5 p.p. |
2.7 p.p. |
| Combined ratio (%)1 |
86.1 |
86.1 |
86.7 |
88.0 |
1.9 p.p. |
1.3 p.p. |
| Policyholders/participants and clients (thousands) |
45,675 |
46,956 |
49,806 |
51,266 |
12.2 |
2.9 |
| Employees (unit) |
7,383 |
7,113 |
7,023 |
7,120 |
(3.6) |
1.4 |
| Market Share of insurance written premiums, pension plan contributions and capitalization bond income (%)2 |
24.2 |
24.4 |
25.5 |
24.8 |
0.6 p.p. |
(0.7) p.p. |
1. Excludes additional provisions.
2. In 2016, considers the latest data made available by Susep (November).
FEE INCOME
Our fee income, which accounts for around 30% of our earnings, has been growing steadily with excellent prospects for continued expansion, mainly due to the improvement of the client segmentation process.
In 2016, fee income totaled R$28,024 million, an increase of R$3,185 million or 12.8% over 2015, driven mainly by: (i) the increase in operational volume, the result of ongoing investment in the service channels and in technology, allied with the growth provided by the acquisition of HSBC Brasil in the third quarter of 2016; and (ii) by progress in the client segmentation process, to ensure an improved offering of products and services. The revenues that most contributed to this result were from: (i) the growth in checking account revenues, basically the result of improved client segmentation; (ii) the robust performance of card activities, due to (a) the increase in the financial volume transacted and (b) the higher number of transactions; and the growth in revenues from: (iii) fund management; (iv) consortium management; (v) underwriting/financial advisory services; (vi) collection; and (vii) custody and brokerage services.
(R$ million) |
2013 |
2014 |
2015 |
2016 |
Variation (%) |
2016 x 2013 |
2016 x 2015 |
Card income |
7,165 |
8,129 |
9,612 |
10,374 |
44.8 |
7.9 |
Checking accounts |
3,608 |
4,021 |
4,946 |
6,012 |
66.6 |
21.6 |
Fund management |
2,324 |
2,449 |
2,617 |
3,090 |
33.0 |
18.1 |
Loan operations |
2,242 |
2,582 |
2,801 |
2,811 |
25.4 |
0.4 |
Collection |
1,471 |
1,566 |
1,574 |
1,778 |
20.9 |
13.0 |
Consortium management |
722 |
880 |
1,040 |
1,279 |
77.1 |
23.0 |
Underwriting/financial advisory services |
568 |
637 |
541 |
745 |
31.2 |
37.7 |
Custody and brokerage services |
511 |
520 |
557 |
725 |
41.9 |
30.2 |
Payments |
340 |
373 |
383 |
374 |
10.0 |
(2.3) |
Others |
835 |
931 |
767 |
837 |
0.2 |
9.1 |
Total |
19,786 |
22,089 |
24,839 |
28,024 |
41.6 |
12.8 |
PERSONNEL EXPENSES
During the year, personnel expenses totaled R$17,637 million, growing R$2,938 million or 20.0% against the previous year, explained mainly by the variations in the (i) structural portion, related to increased expenses with salaries, social charges and benefits, impacted by the (a) increase in salary levels in accordance with the collective agreements for 2015 and 2016, and (b) the effect of the consolidation of HSBC Brasil from the third quarter of 2016; and (ii) the non structural portion, a reflex, in part, of higher expenses with (a) management and employee profit share and (b) severance costs.
Personnel Expenses (R$ Million)
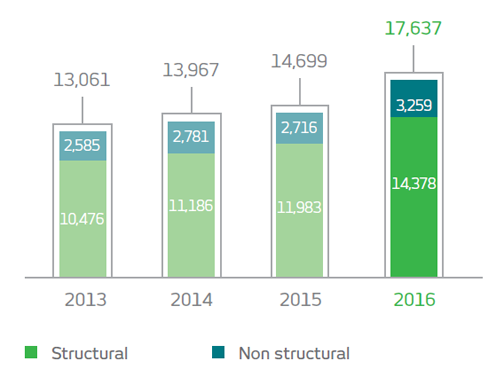 Obs.: Structural = salaries + social charges + benefits + pension plan; and
Non structural = Profit share plan + training + Labor provision + severance costs.
Employees*
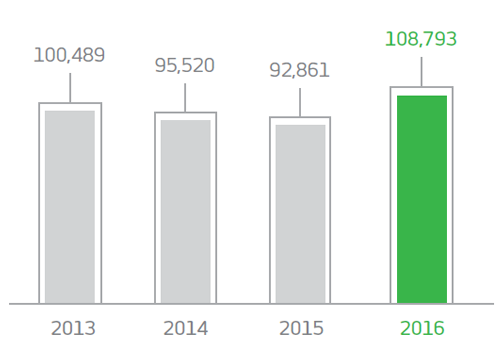 * In 2016, includes 21,016 HSBC Brasil employees; and in 2014, includes the transfer of 2,431 Scopus Tecnologia employees to IBM Brasil.
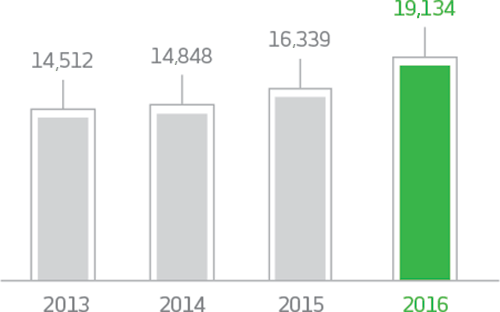
ADMINISTRATIVE EXPENSES
Due to the efforts of the Efficiency Committee, we have been able to maintain our administrative expenses at a controlled level, helping to improve the Operating Efficiency Ratio.
In 2016, administrative expenses totaled R$19,134 million, 17.1% or R$2,795 million higher than in 2015, reflecting the increase in expenses caused by: (i) the growth in business and service volume in the period, impacted partially by the effect of the consolidation of HSBC Brasil from the third quarter of 2016; (ii) by contract readjustments; and (iii) by the cost of advertising and marketing actions, mainly related to the 2016 Rio Olympic and Paralympic games in the third quarter of the year.
Administrative Expenses (R$ Million)
Service Points (Units)*
* In 2016 and 2015, the reduction refers to: (i) the migration of Bradesco ATM Network external points to the Banco 24Horas network; (ii) the deactivation of ATMs in the Banco24Horas network; and (iii) the decrease in the number of Bradesco Expresso correspondents.
BREAKDOWN OF PERSONNEL AND ADMINISTRATIVE EXPENSES
In 2016, personnel and administrative expenses totaled R$36,771 million, an increase of 18.5% or R$5,733 million, caused in part by the effect of the consolidation of HSBC Brasil from the third quarter of the year.
| (R$ million) |
2013 |
2014 |
2015 |
2016 |
Variation (%) |
| 2016 x 2013 |
2016 x 2015 |
| Personnel expenses |
|
|
|
|
|
|
| Structural |
10,476 |
11,186 |
11,983 |
14,378 |
37.2 |
20.0 |
| Salaries/social charges |
7,798 |
8,282 |
8,834 |
10,612 |
36.1 |
20.1 |
| Benefits |
2,678 |
2,904 |
3,149 |
3,766 |
40.6 |
19.6 |
| Non structural |
2,585 |
2,781 |
2,716 |
3,259 |
26.1 |
20.0 |
| Management and employee profit share plan |
1,407 |
1,536 |
1,580 |
1,846 |
31.2 |
16.8 |
| Provision for labor claims |
806 |
793 |
705 |
771 |
(4.3) |
9.4 |
| Training |
127 |
145 |
145 |
176 |
38.6 |
21.4 |
| Severance costs |
245 |
307 |
286 |
466 |
90.2 |
62.9 |
| Total |
13,061 |
13,967 |
14,699 |
17,637 |
35.0 |
20.0 |
| (R$ MILLION) |
2013 |
2014 |
2015 |
2016 |
Variation (%) |
| 2016 x 2013 |
2016 x 2015 |
| Administrative expenses |
|
|
|
|
|
|
| Outsourced services |
4,134 |
3,942 |
4,124 |
4,772 |
15.4 |
15.7 |
| Depreciation and amortization |
1,665 |
1,906 |
2,121 |
2,501 |
50.2 |
17.9 |
| Data processing |
1,297 |
1,342 |
1,600 |
2,002 |
54.4 |
25.1 |
| Communication |
1,608 |
1,524 |
1,653 |
1,876 |
16.7 |
13.5 |
| Advertising and marketing |
793 |
934 |
1,064 |
1,279 |
61.3 |
20.2 |
| Asset maintenance |
661 |
700 |
1,033 |
1,155 |
74.7 |
11.8 |
| Rental |
830 |
896 |
942 |
1,102 |
32.8 |
17.0 |
| Financial system services |
732 |
774 |
835 |
1,022 |
39.6 |
22.4 |
| Security and surveillance |
495 |
559 |
609 |
740 |
49.5 |
21.5 |
| Transportation |
832 |
776 |
642 |
727 |
(12.6) |
13.2 |
| Water, electricity and gas |
225 |
237 |
345 |
390 |
73.3 |
13.0 |
| Materials |
310 |
342 |
336 |
335 |
8.1 |
(0.3) |
| Travel |
138 |
156 |
168 |
179 |
29.7 |
6.5 |
| Others |
793 |
760 |
867 |
1,053 |
32.8 |
21.5 |
| Total |
14,512 |
14,848 |
16,339 |
19,134 |
31.8 |
17.1 |
| Total personnel and administrative expenses |
27,573 |
28,815 |
31,038 |
36,771 |
33.4 |
18.5 |
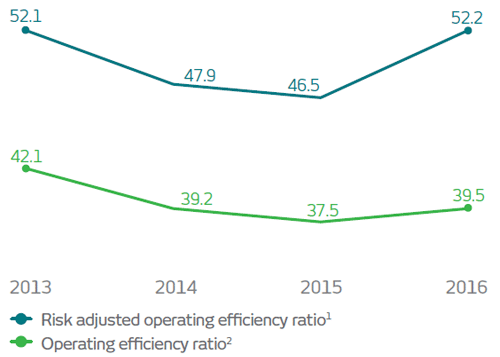
OPERATING EFFICIENCY RATIO (ER)1
The Operating Efficiency Ratio (ER) ended 2016 at 39.5%, 2.0 percentage points higher than 2015. If we were to not consider the effect of the impairment of financial assets (previously stated in shareholders' equity) amounting to R$1,264 million in the fourth quarter, the indicator would be 38.9%. The factors that most contributed to this performance were: (i) the increase in operational expenses in the period, impacted by the effect of the consolidation of HSBC Brasil from the third quarter of the year; offset: (ii) by the growth in revenue from (a) service provision due to the higher volume of business and services provided and (b) by the financial margin.
The Operating Efficiency Ratio on a risk adjusted basis, which reflects the impact of risk associated with lending operations2, reached 52.2% (51.2% not considering the effect of impairment), mainly due to the effect of the alignment of the level of provisioning for corporate client operations in the first half of the year.
Excluding the impacts of the consolidation of HSBC Brasil and the impairment of financial assets, the performance of the Operating Efficiency Ratio reflects our sustainable growth strategy, which includes, among others, (i) the provision of products and services suitable for clients by means of the segmentation of the client base and the digital channels, (ii) the optimization of the service points and (iii) ongoing control of operational expenses, the result of the actions of the Efficiency Committee and
investments in Information Technology, which
totaled R$6.595 billion in the year.
1. ER = (personnel expenses - profit share + administrative expenses)/(financial margin + fee and commission income + insurance income + equity in the earnings of unconsolidated companies + other operating income - other operating expenses).
2. Including Allowance for Loan Loss (ALL) expenses adjusted for discounts granted, loan recovery and sale of foreclosure assets, among others.
(%)
 1. Including ALL Expenses adjusted for discounts granted, loan recovery and sale of foreclosure assets, among others.
2. ER = (personnel expenses -profit share + administrative expenses)/(financial margin + fee and commission income + insurance income + equity in the earnings of unconsolidated companies + other operating income – other operating expenses).
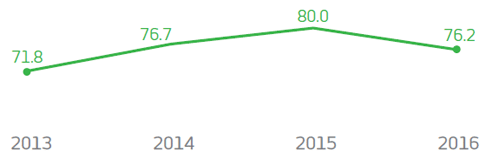
OPERATING COVERAGE RATIO
The ratio* was 76.2% at the end of 2016, impacted in part by the increase in operational expenses caused by the consolidation of HSBC Brasil from the third quarter of the year. However, maintenance of this indicator at a high level is due essentially to the ongoing expense control efforts, including (a) the actions of the Efficiency Committee, (b) investments in information technology, which totaled R$6.595 billion in the year, and (c) measures to expand the product and service offering to the entire client base.
* Fee and commission income/administrative and personnel expenses.
(%)
ADJUSTED BALANCE SHEET
In December 2016, the balance of total assets was R$1.294 trillion, growth of 19.8% over the same period the previous year.
Shareholders' equity was R$100.442 billion, 13.0% up on 2015.
| (R$ million) |
Dec/13 |
Dec/14 |
Dec/15 |
Dec./16 |
Variation (%) |
| 2016 x 2013 |
2016 x 2015 |
| Assets |
|
|
|
|
|
|
| Current and long term assets |
892,495 |
1,016,970 |
1,059,768 |
1,262,273 |
41.4 |
19.1 |
| Cash and cash equivalents |
12,196 |
14,646 |
17,457 |
14,697 |
20.5 |
(15.8) |
| Interbank investments |
135,456 |
202,412 |
140,457 |
177,685 |
31.2 |
26.5 |
| Securities and derivative financial instruments |
313,327 |
346,358 |
407,584 |
549,873 |
75.5 |
34.9 |
| Interbank and interdepartmental accounts |
56,995 |
52,004 |
55,728 |
59,007 |
3.5 |
5.9 |
| Loan and leasing operations |
296,629 |
318,233 |
333,854 |
347,489 |
17.1 |
4.1 |
| Allowance for loan losses (ALL)* |
(21,349) |
(22,724) |
(28,805) |
(37,653) |
76.4 |
30.7 |
| Other receivables and assets |
99,241 |
106,041 |
133,493 |
151,175 |
52.3 |
13.2 |
| Permanent assets |
15,644 |
15,070 |
19,987 |
31,286 |
100.0 |
56.5 |
| Investments |
1,830 |
1,712 |
1,587 |
1,778 |
(2.8) |
12.0 |
| Premises and leased assets |
4,668 |
4,887 |
5,772 |
7,965 |
70.6 |
38.0 |
| Intangible assets |
9,146 |
8,471 |
12,628 |
21,543 |
135.5 |
70.6 |
| Total |
908,139 |
1,032,040 |
1,079,755 |
1,293,559 |
42.4 |
19.8 |
(R$ MILLION) |
Dec/13 |
Dec/14 |
Dec/15 |
Dec/16 |
Variation (%) |
2016 x 2013 |
2016 x 2015 |
Liabilities |
|
|
|
|
|
|
Current and long term liabilities
|
835,917 |
949,846 |
988,833 |
1,191,094 |
42.5 |
20.5 |
Deposits
|
218,063 |
211,612 |
195,760 |
234,214 |
7.4 |
19.6 |
Federal funds purchased
|
256,279 |
320,194 |
279,726 |
349,070 |
36.2 |
24.8 |
Funds from issuance of securities
|
57,654 |
84,825 |
109,547 |
150,807 |
161.6 |
37.7 |
Interbank and interdepartmental accounts
|
6,864 |
5,958 |
6,384 |
7,089 |
3.3 |
11.0 |
Borrowing and onlending
|
56,095 |
58,998 |
70,338 |
58,197 |
3.7 |
(17.3) |
Derivative financial instruments
|
1,808 |
3,282 |
13,785 |
12,398 |
585.7 |
(10.1) |
Reserves for insurance, pension plans
and capitalization bonds
|
136,229 |
153,267 |
177,835 |
223,342 |
63.9 |
25.6 |
Other reserve requirements
|
102,925 |
111,710 |
135,458 |
155,977 |
51.5 |
15.1 |
Deferred income |
677 |
293 |
529 |
477 |
(29.5) |
(9.8) |
Non-controlling interest in subsidiaries |
605 |
393 |
1,486 |
1,546 |
155.5 |
4.0 |
Shareholders' equity |
70,940 |
81,508 |
88,907 |
100,442 |
41.6 |
13.0 |
Total |
908,139 |
1,032,040 |
1,079,755 |
1,293,559 |
42.4 |
19.8 |
* Including the provision for sureties in December 2016, the coverage ratios for doubtful debtors totaled R$40,714 million, which classifies as excessive ALL.
STATEMENT OF CHANGES IN SHAREHOLDERS' EQUITY
| (R$ million) |
Dec/13 |
Dec/14 |
Dec/15 |
Dec/16 |
| Opening balance |
70,047 |
70,940 |
81,508 |
88,907 |
Acquisition of treasury shares
|
(72) |
(29) |
(133) |
(10) |
Asset valuation adjustments
|
(6,969) |
563 |
(3,623) |
3,437 |
Net profit
|
12,011 |
15,089 |
17,190 |
15,084 |
Allocations:
|
|
|
|
|
- Interest on own shareholders' equity paid and/or provisioned
|
(3,224) |
(3,595) |
(5,123) |
(6,976) |
- Interim dividends paid and/or provisioned
|
(854) |
(1,460) |
(912) |
- |
| Final balance |
70,940 |
81,508 |
88,907 |
100,442 |
CONSOLIDATED CASH FLOW STATEMENT
| (R$ MILLION) |
Dec/13 |
Dec/14 |
Dec/15 |
Dec/16* |
Cash flow from operational activities
|
104,243 |
110,463 |
(29,044) |
52,664 |
Cash flow from investment activities
|
(30,561) |
(19,137) |
(38,749) |
(13,954) |
Cash flow from financing activities
|
(3,412) |
(4,340) |
10,400 |
(4,720) |
Net increase/(decrease) in cash and cash equivalents
|
70,270 |
86,986 |
(57,393) |
33,990 |
| Cash and cash equivalents – beginning of period |
47,555 |
117,825 |
204,812 |
147,419 |
| Cash and cash equivalents – end of period |
117,825 |
204,812 |
147,419 |
181,409 |
* For further information please refer to explanatory note no. 5 – Balance Sheet and Income Statement from the Financial Statements of the year ended on December 31, 2016.
EXPANDED LOAN PORTFOLIO*
At the end of the year, we expanded loan portfolio totaled R$515.0 billion, growing 8.6% over the previous year. This included the consolidation of HSBC Brasil from the third quarter, with the corporate segment growing 5.1%, impacted by the large company segment, while loans for individuals grew 16.4%. The products for individuals that grew most over the last 12 months were: (i) real estate financing; and (ii) credit cards. For corporations, worthy of note were: (i) credit risk operations – commercial portfolio (bonds and promissory notes); and (ii) export finance.
(R$ BILLION, UNLESS OTHERWISE STATED)
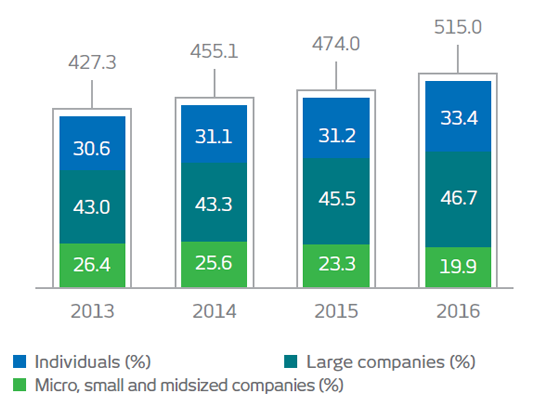
* In addition to the credit portfolio – according to the Bacen definition – it includes sureties, guarantees, letters of credit, advances on credit card receivables, debentures, promissory notes, co-obligation in loan assignments to investment funds, real estate and agricultural credit receivables
BREAKDOWN OF EXPANDED LOAN PORTFOLIO BY PRODUCT AND TYPE (INDIVIDUAL AND CORPORATE)
| (R$ million) |
Dec/13 |
Dec/14 |
Dec/15 |
Dec/16 |
Variation (%) |
| 2016 x 2013 |
2016 x 2015 |
| Individual |
|
|
|
|
|
|
| Payroll-deductible loans |
26,786 |
29,619 |
34,565 |
38,804 |
44.9 |
12.3 |
| Credit card |
23,915 |
26,233 |
28,592 |
35,622 |
49.0 |
24.6 |
| Real estate financing |
13,602 |
17,919 |
22,781 |
32,298 |
137.5 |
41.8 |
| CDC/Vehicle leasing |
27,251 |
24,858 |
21,689 |
19,952 |
(26.8) |
(8.0) |
| Personal loans |
16,476 |
16,354 |
15,201 |
18,437 |
11.9 |
21.3 |
| Rural loans |
8,393 |
10,300 |
8,215 |
7,887 |
(6.0) |
(4.0) |
| BNDES/Finame onlending |
6,803 |
7,334 |
7,029 |
6,685 |
(1.7) |
(4.9) |
| Overdraft facilities |
3,313 |
3,666 |
3,905 |
4,509 |
36.1 |
15.5 |
| Sureties and guarantees |
187 |
458 |
707 |
644 |
244.4 |
(9.0) |
| Others |
4,025 |
4,693 |
5,065 |
7,208 |
79.1 |
42.3 |
| Total |
130,750 |
141,432 |
147,749 |
172,045 |
31.6 |
16.4 |
| (R$ million) |
Dec/13 |
Dec/14 |
Dec/15 |
Dec/16 |
Variation (%) |
| 2016 x 2013 |
2016 x 2015 |
| Corporate |
|
|
|
|
|
|
| Working capital |
45,599 |
45,004 |
42,432 |
45,943 |
0.8 |
8.3 |
| Operations abroad |
32,003 |
36,119 |
48,453 |
37,250 |
16.4 |
(23.1) |
| Export financing |
15,366 |
15,839 |
23,158 |
27,829 |
81.1 |
20.2 |
| BNDES/Finame onlending |
33,740 |
34,835 |
31,129 |
29,261 |
(13.3) |
(6.0) |
| Real estate financing |
15,870 |
23,560 |
26,508 |
29,466 |
85.7 |
11.2 |
| Overdrafts |
10,410 |
10,462 |
9,794 |
8,606 |
(17.3) |
(12.1) |
| CDC/Leasing |
13,008 |
12,388 |
9,666 |
8,091 |
(37.8) |
(16.3) |
| Rural loans |
5,258 |
6,657 |
5,404 |
6,531 |
24.2 |
20.9 |
| Sureties and guarantees |
67,399 |
71,611 |
69,176 |
78,304 |
16.2 |
13.2 |
| Operations bearing credit risk – commercial portfolio* |
33,104 |
33,185 |
34,319 |
41,605 |
25.7 |
21.2 |
| Others |
24,765 |
24,035 |
26,238 |
30,061 |
21.4 |
14.6 |
| Total |
296,523 |
313,695 |
326,278 |
342,945 |
15.7 |
5.1 |
* Includes debenture and promissory note operations.
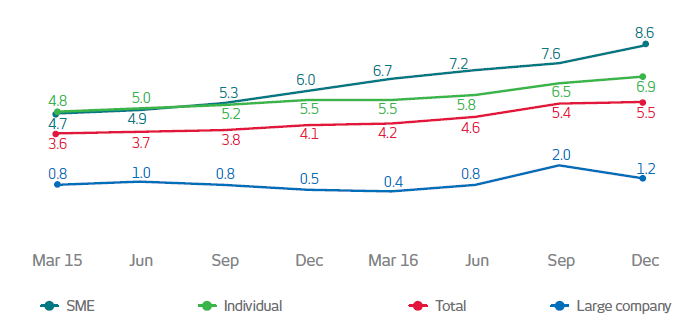
DELINQUENCY RATIO > 90 DAYS*
The indicator, encompassing the balance of operations more than 90 days overdue, grew in 2016, reflecting the low demand for loans and the intensification of the deceleration of economic activity, which has impacted payment capacity, particularly for companies. However, worthy of note is the improvement in delinquency in the large company segment in the last quarter, with a decrease from 2.0% to 1.2%.
Also in the last quarter, loans totaling R$2 .0 billion that had already been written off as losses were negotiated without retention of risks or benefits. This did not affect the delinquency rates in the period nor did it have a significant effect on results.
* As defined by the Central Bank, Bacen.
(%)
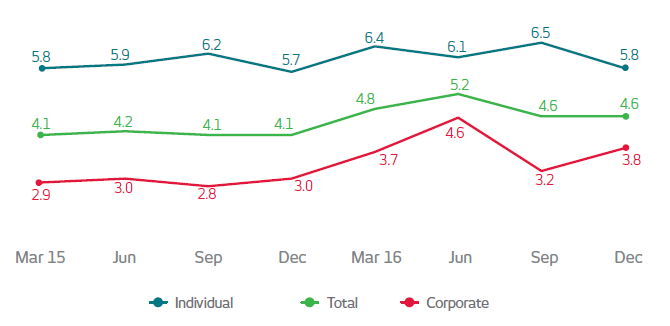
DELINQUENCY RATE FROM 15 TO 90 DAYS*
In the last quarter of 2016, short-term delinquency involving operations overdue between 15 and 90 days grew due to a fully provisioned client in the Large Company segment migrating from one overdue category band to another.
Noteworthy is the improvement of this indicator in the Individual segment, with a reduction of 0.7 of a percentage point in the same period.
* As defined by the Central Bank, Bacen.
(%)
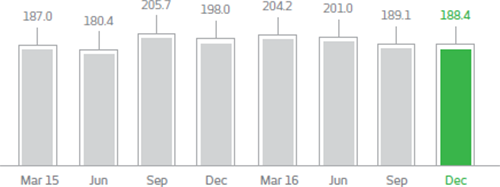
COVERAGE RATIOS ABOVE 60 AND 90 DAYS1, 2
The charts at the side show the behavior of the coverage ratios for doubtful debtors overdue more than 60 and 90 days, taking HSBC Brasil into account from July. In December, the ratios showed very comfortable levels, with 158.8% and 188.4% coverage respectively.
This indicator reflects the consistency and robustness of credit concession policies and processes, as well as the quality of the guarantees obtained. We have a greater coverage level than required by regulatory bodies, helping to ensure business continuity. In addition to the allowance for loan losses required by Bacen, We have a R$7.5 billion excess provision to enable it to overcome potential situations of stress, as well as other operations/commitments involving credit risk.
1. As defined by Bacen.
2. Includes a provision for guarantees provided, encompassing sureties, guarantees, letters of credit and standby letters of credit, in line with the concept of excess allowance for loan losses.
Coverage Rate Above 60 Days (%)
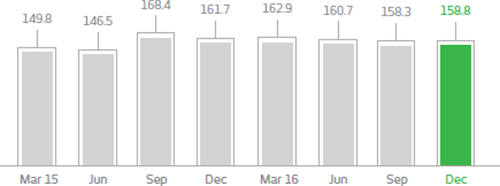
Coverage Rate Above 90 Days (%)
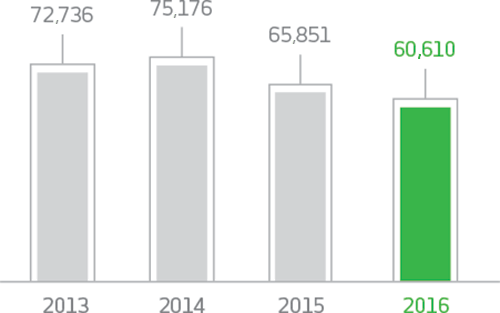
FUNDS UNDER MANAGEMENT
The funds raised and under management totaled R$1.905 trillion, a variation of R$394,516 million or 26.1% compared with 2015. This is due mainly to the increase: (i) in funds managed in Brazilian currency, amounting to R$206,204 million; (ii) funds raised on the open market, amounting to R$69,344 million; (iii) the technical reserves for insurance, pension plans and capitalization bonds, amounting to R$45,507 million; and (iv) the revenues from the issuance of securities amounting to R$41,474 million.
We present limited dependence on interbank and external funds due to the efficiency with which it raises funds from clients in the domestic market. This efficiency is the result of (i) the exceptional positioning of its service points, (ii) the broad diversity of the products on offer and (iii) market confidence in our brand.
| (R$ million) |
Dec/13 |
Dec/14 |
Dec/15 |
Dec/16 |
Variation (%) |
| 2016 x 2013 |
2016 x 2015 |
| Raised |
824,692 |
937,369 |
960,113 |
1,148,424 |
39.3 |
19.6 |
| Deposits |
218,063 |
211,612 |
195,760 |
234,214 |
7.4 |
19.6 |
| Securities sold under agreements to repurchase |
256,279 |
320,194 |
279,726 |
349,070 |
36.2 |
24.8 |
| Funds from acceptance and issuance of securities |
54,592 |
82,335 |
106,275 |
147,749 |
170.6 |
39.0 |
| Borrowing and onlending obligations |
56,095 |
58,998 |
70,338 |
58,197 |
3.7 |
(17.3) |
| Subordinated debt |
35,885 |
35,822 |
50,283 |
52,611 |
46.6 |
4.6 |
| Securitization of future financial flows |
3,062 |
2,490 |
3,272 |
3,058 |
(0.1) |
(6.5) |
| Own capital/under management* |
55,901 |
66,831 |
70,406 |
70,702 |
26.5 |
0.4 |
| Withholding and other taxes and obligations |
815 |
435 |
601 |
732 |
(10.2) |
21.8 |
| Foreign exchange portfolio |
7,771 |
5,385 |
5,617 |
8,749 |
12.6 |
55.8 |
Technical reserves for insurance, pension plans
and capitalization bonds |
136,229 |
153,267 |
177,835 |
223,342 |
63.9 |
25.6 |
| Managed in local currency |
435,364 |
488,730 |
550,284 |
756,488 |
73.8 |
37.5 |
| Total |
1,260,056 |
1,426,099 |
1,510,396 |
1,904,912 |
51.2 |
26.1 |
* Shareholders' Equity under management (-) Permanent Assets.
OUTLOOK FOR 2017
The following table contains forward-looking statements which are subject to risks and uncertainties because they were based on our management's assumptions and expectations and information available in the market up until February 2nd, 2017, the date the 2016 results were disclosed, and which may be subject to alterations during the course of 2017. For further information, refer to the Report on Economic and Financial Analysis published quarterly and available on our Investor Relations website (www.bradesco.com.br/ir –> Reports and Spreadsheets > Financial Information).
| |
Pro forma* |
Published |
| Expanded loan portfolio |
1 to 5% |
1 to 5% |
| NII – Interest earning portion |
-4 to 0% |
3 to 7% |
| Fee and commission income |
7 to 11% |
12 to 16% |
| Operating Expenses (Administrative and Personnel expenses) |
-1 to 3% |
10 to 14% |
| Insurance premiums |
4 to 8% |
6 to 10% |
ALL expenses
(Includes credit recovery revenues) |
R$21.0 billion to
R$24.0 billion |
R$21.0 billion to
R$24.0 billion |
* Includes the incorporation of HSBC Brasil throughout the period analyzed to enable comparability.