


Since 2007, in a pioneering stance Eternit has adopted the International Financial Reporting Stardard (IFRS) or the measurement of its operational and financial results, this being a set of international accounting standards which became obligatory for listed companies only in 2010. There are therefore no significant impacts on information for 2012.
Net Consolidated Revenue
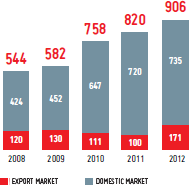
Eternit’s net Consolidated revenue for the year 2012 amounted to a total of R$906.3 million, up 10.5% compared to 2011, as a result of goods sales performance in the export market, which totalled R$170.9 million – an increase of 70.2% compared to the previous year, due to increased volume, higher prices, and appreciation of the US dollar against the Brazilian real.
In the same period, sales to the domestic market totalled R$735.4 million, up 2.2% compared to the previous year, due to price repositioning throughout the company’s portfolio, which had the effect of neutralising the reduction in sales volume in the domestic market as a result of lower demand for construction materials.
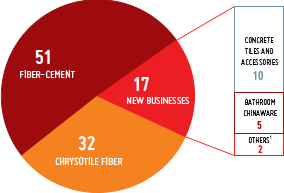
Revenue from the sale of chrysotile asbestos totalled R$294.4 million, up 39.1% compared to 2011, as a function of price increases and exchange-rate appreciation. Taking the same comparison period, sales in the fiber-cement segment remained practically stable, totalling R$460.1 million, while sales of concrete tiles, including the line of roofing accessories, saw a drop of 2.9%, to R$86.9 million, due to the slowdown in the sector, partly compensated for by price increases implemented during the year. The line of other products also saw an increase in sales of 6.6%, for the same reasons, totalling R$64.9 million, of particular note being vitreous chinaware sales which accounted for 4.6% of consolidated net revenue.
1 Metallic roofing tiles, polyethylene water tanks, lavatory seats and metallic bathroom fittings, water pipe filters, synthetic marble, and components for construction systems. |
 |
Cost of Goods Sold (COGS)
For the year 2012 the Consolidated Cost of Goods Sold (COGS) totalled R$509.5 million, up 2.6% compared to 2011, gross margin widened by 4 percentage points compared to 2011, ending 2012 at 43%, as a function of better control over extraction and production costs, in relation to volumes produced, price increases implemented and a favourable exchange rate. The cost structures for the fiber-cement, concrete tile and mining operations experienced no significant variation compared to 2011.
Cost of Goods Sold - Concrete Tiles1 (%) |
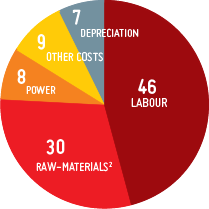
Cost of Goods Sold - Chrysotile Fiber1 (%) |
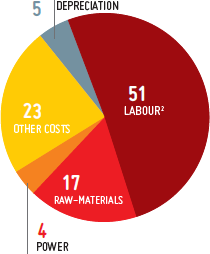
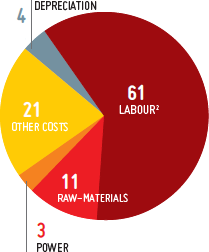
Cost of Goods Sold Fiber - Cement Production1 (%) |
||
 |
 |
|||
 |
||||
| 1 Approximated values. 2 Cement, sand and others. |
1 Approximated values. 2 Fuel, explosives, packaging and others. |
1 Approximated values. 2 Cement, chrysotile mineral and others. |
Net financial result
The financial result in 2012 was a positive R$2.2 million, 83.7% lower than in 2011, principally as a result of the effects of exchange rate variation referring to transactions by SAMA and tax gains as a result of the recovery of PIS/COFINS credits as a consequence of the declaration of unconstitutionality of the rate increase during the period 2001 to 2004, recorded in 2011.
|
THE NET FINANCIAL RESULT WAS IMPACTED, PRINCIPALLY, BY THE EFFECTS OF EXCHANGE RATE VARIATION |
Ebitda
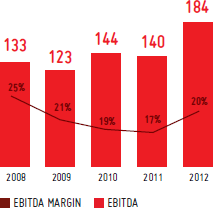
EBITDA (R$ million) |
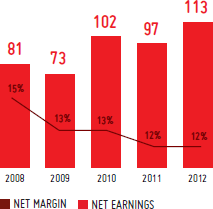
Net earnings, (R$ million) |
|
 |
 |
Consolidated Ebitda (earnings before interest, tax, depreciation and amortization) totalled R$184.3 million in 2012, up 31.6% compared to that reported in 2011. This list was principally due to price repositioning throughout the Company’s portfolio and and higher exchange rate variation, the result of the appreciation of the US dollar against the Brazilian real, which had a positive impact on exports by the mining company SAMA. As a consequence, Ebitda margin widened by 3 percentage points, compared to 2011, ending 2012 at 20%.
The calculation of Ebitda is in line with CVM (Brazilian Securities Commission) Instruction No. 527 of October 4, 2012.
Net earnings
Eternit reported net earnings of R$113.0 million in 2012, up 16.3% compared to 2011, as a result of the aspects commented on for Ebitda, which were partly offset by a lower financial result, as a consequence of the first expenses of Companhia Sulamericana de Cerâmica, the joint-venture between Eternit and Organizações Corona. As a result, net margin remained almost unchanged compared to 2011, ending 2012 at 12%.
Consolidated cash flow
Eternit is a strong generator of cash, and as a result of investments carried out and a short-term financial investment made in 2012, ended the year with cash balance of R$16.7 million, down 60.7% compared to 2011. It should be emphasized that this short-term financial investment is not considered as “cash and equivalents” due to its characteristics. As at December 31, 2012, the balance of this short-term financial application amounted to R$78.9 million, this figure being subtracted from the investment cash flow.
| R$ '000 | 2012 | 2011 | Variation (%) |
|---|---|---|---|
| Initial balance | 42,333 | 39,751 | 6.5 |
| Operational cash flow | 126,145 | 88,852 | 42.0 |
| Investment cash flow | (115,063) | (28,354) | 305.8 |
| Cash flow from financing | (36,759) | (57,916) | (36.5) |
| End balance | 16,656 | 42,333 | (60.7) |
asas
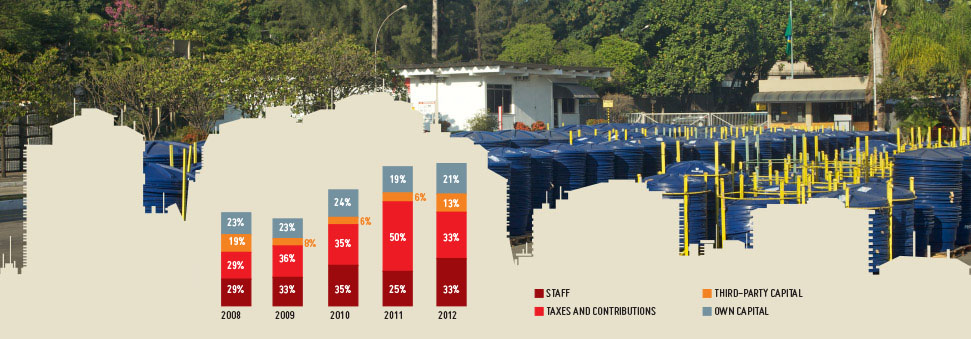
Total cost of capital
The Executive Board is of the opinion that Company’s current capital structure is compatible with its level of indebtedness, and that the Company significantly leverages its operations using non-interest-bearing funds and its own capital, having a margin to leverage its operations with interest-bearing capital whenever business feasibility studies show themselves to be positive. Over the last two years, the Company’s assets were financed in the following manner:
| 2012 | 2011 | |||
|---|---|---|---|---|
| R$’000 | % | R$’000 | % | |
| Own capital | 479,534 | 59.2 | 438,106 | 63.3 |
| Third-party capital | 330,586 | 40.8 | 253,829 | 36.7 |
| 810,120 | 100.0 | 691,935 | 100.0 | |
In a comparison with the previous year, the Company’s own capital was increased by R$41,428,000, corresponding to the constitution of profit reserves of R$40,575,000, already including the constitution of an investment reserve of R$29,275,000.
While third-party capital, 62.9% of which was repayable in the short term, and 37.1% over the long term, increased by R$76,757,000 compared to the same period, of particular note are being loans and financing, of R$31,502,000 and provisions of R$20,487,000.
Remunerated debt
The Company ended 2012 with a net debt of R$15.6 million.
Debt with financial institutions (interest-bearing capital) increased from R$48,444,000 in 2011, to R$79,946, 000 as at December 31, 2012, as a result of the raising of funds through an import financing credit line (FINIMP), by Eternit, and the raising of funding from BNDES/FINAME or the purchase of trucks, machinery and equipment, and Advances on Foreign Exchange Contracts to leverage the working capital of subsidiary SAMA. In 2012, only 9.8% of the Company’s total assets were financed from financial institutions.
Cash and equivalents and short-term financial investment applications totalled R$95.6 million, with this financial application being remunerated at an average rate of 103% of the variation in the CDI rate (Interbank Deposit Certificate).
It should be pointed out that the Company does not use leveraged derivative operations of any type that could be construed as speculative positions.
| Interest-bearing debt (R$'000) | 2012 | 2011 | Variation (%) |
|---|---|---|---|
| Gross debt | 79,946 | 48,444 | 65.0 |
| Cash and equivalents caixa | (16,656) | (42,333) | (60.7) |
| Short-term financial applications | (78,930) | (26,588) | 196.9 |
| Net debt | (15,640) | (20,477) | (23.6) |
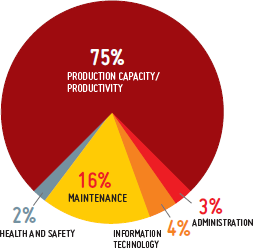
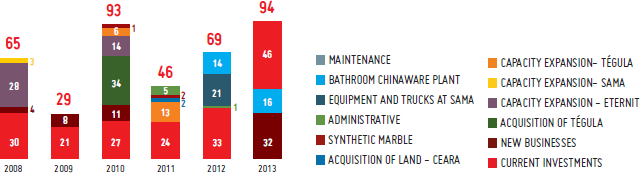
Investments
In 2012, the capital expenditure total amounted to R$69.4 million, being R$21 million on the purchase of machinery and equipment and trucks for the mining company, R$33.2 million mainly for maintenance and modernization of the industrial park, R$13.6 million referring to a capital injection into Companhia Sulamericana de Cerâmica (CSC) for the construction of the new vitreous chinaware plant and R$1.6 million for the acquisition of licences and switching over to the new SAP version.
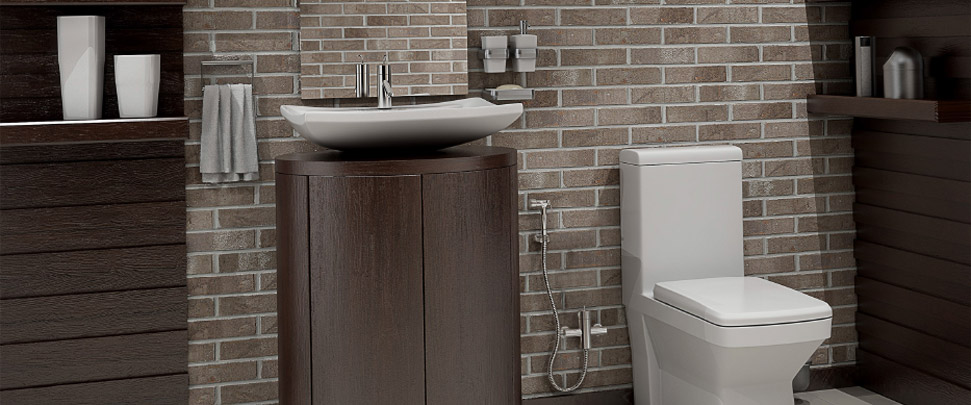
In line with its growth and diversification initiatives, the Company’s investment focus continues to be on production, and the construction of its first bathroom chinaware plant, at its mult-product unit, which will be built in the Port of Pecém, in the state of Ceará. Works are scheduled for completion by the end of December 2013, with investment of approximately R$100 million. Companhia Sulamericana de Cerâmica will raise approximately 60% of its capital from banks in the public sector, and 40% from its own resources, in the proportion of the joint-venture shareholding split 60% (Eternit) and 40% (Grupo Corona).
Distribution of |
Investments realised and planned |
|
 |
 |
|
The investment budget for 2013 is approximately R$94 million, with R$46.4 million to be spent on maintenance and updating of the industrial park; R$16 million referring to capital injections for the vitreous chinaware plant, and R$31.6 million for new business.
It should be pointed out that the funds from the public-sector banks to be allocated to the vitreous chinaware plant have not been computed in the capital expenditure forecast for 2013, due to its joint-venture status.
Statement of Value-Added (DVA)
EC1Value added for the year totalled R$528.6 million, up 14.4% compared to 2011. Of this amount we emphasise the balance between the distribution of amounts to employees and federal, state and municipal governments in the form of taxes and contributions. 21.4% of the value added was distributed to shareholders.
| Consolidated statement of value added (DVA) (R$'000) | 2012 | 2011 | 2010 | 2009 | 2008 |
|---|---|---|---|---|---|
| REVENUES | 1,207,617 | 1,080,020 | 1,010,679 | 759,675 | 705,922 |
| Sales of merchandise, products and services | 1,159,627 | 1,071,780 | 991,302 | 743,393 | 697,548 |
| Other revenues | 48,955 | 6,454 | 8,442 | 8,502 | 10,407 |
| Provision for lost due to reduction in recoverable value | 2,195 | 13,188 | 8,843 | - | |
| Bad debt provisions – reversion/(booked) | (965) | (409) | (2,253) | (1,063) | (2,033) |
| INPUTS REQUIRED FROM THIRD PARTIES | (696,248) | (635,379) | (595,454) | (442,151) | (412,337) |
| Cost of products, merchandise and services sold | (523,053) | (465,104) | (389,845) | (236,156) | (181,171) |
| Matériel, power, outsourced services and others | (161,998) | (159,859) | (192,097) | (200,007) | (228,453) |
| Loss/recovery of asset values | (7,271) | (9,363) | (7,736) | (5,319) | (186) |
| Other donations | (3,926) | (1,053) | (5,776) | (669) | (2,527) |
| GROSS VALUE ADDED (1 - 2) | 511,369 | 444,641 | 415,225 | 317,524 | 293,585 |
| DEPRECIATION, AMORTISATION AND EXHAUSTION | (28,773) | (22,806) | (18,154) | (17,991) | (17,357) |
| NET VALUE ADDED PRODUCED BY THE ENTITY (3 - 4) | 482,596 | 421,835 | 397,071 | 299,533 | 276,228 |
| VALUE-ADDED RECEIVED IN TRANSFER | 46,023 | 40,301 | 33,617 | 23,245 | 69,423 |
| Equity income result | (531) | 0 | - | - | - |
| Financial revenues | 39,006 | 43,059 | 32,400 | 18,364 | 67,026 |
| Others | 7,548 | (3,358) | 1,217 | 4,881 | 2,397 |
| TOTAL VALUE ADDED TO BE DISTRIBUTED (5 + 6) | 528,619 | 462,136 | 430,688 | 322,778 | 345,651 |
| DISTRIBUTION OF VALUE ADDED | 528,619 | 462,136 | 430,688 | 322,778 | 345,651 |
| Personnel | 175,636 | 158,710 | 150,208 | 105,644 | 99,071 |
| Direct remuneration | 112,991 | 105,313 | 94,054 | 67,272 | 68,831 |
| Benefits | 53,571 | 44,490 | 49,539 | 33,147 | 25,953 |
| F.G.T.S. | 9,074 | 8,907 | 6,615 | 5,225 | 4,287 |
| Taxes and contributions | 172,130 | 170,303 | 151,060 | 116,937 | 99,572 |
| Federal | 123,215 | 122,919 | 110,047 | 91,751 | 84,481 |
| State | 47,603 | 46,129 | 39,878 | 23,987 | 13,945 |
| Municipal | 1,312 | 1,255 | 1,135 | 1,199 | 1,146 |
| Remuneration of third-party capital | 67,849 | 35,930 | 27,335 | 27,078 | 65,704 |
| Interests | 36,016 | 28,300 | 22,524 | 24,605 | 63,626 |
| Rent | 31,833 | 7,630 | 4,811 | 2,473 | 1,499 |
| Others | - | - | - | 579 | |
| Remuneration of own capital | 113,004 | 97,193 | 102,085 | 73,119 | 81,304 |
| Interest on equity | 24,068 | 23,620 | 22,367 | 15,118 | 14,456 |
| Dividends | 47,509 | 47,956 | 58,155 | 40,203 | 54,167 |
| Profit retained | 41,427 | 25,617 | 21,562 | 17,793 | 12,680 |
| Participation of long controlling shareholders in retained profits | - | 1 | 5 | 1 |
EC9
| Significant indirect economic impacts, including the extent of impacts – 2012 (in R$) | |||
|---|---|---|---|
| Units in the Eternit Group | State | ICMS levied | Value of the participation fund of the municipality (FPM) |
| Goiânia plant | Goiás | 24,970,172 | 145,426,297 |
| Anápolis plant | Goiás | 10,424,262 | 85,272,001 |
| Simões Filho plant | Bahia | 15,263,239 | 17,660,348 |
| Rio de Janeiro plant | Rio de Janeiro | 17,643,529 | 141,386,677 |
| Colombo plant | Paraná | 16,516,917 | 39,871,439 |
| Tégula Atibaia plant | São Paulo | 4,432,803 | 28,292,442 |
| Tégula Içara plant | Santa Catarina | 1,250,080 | 12,675,699 |
| Tégula Camaçari plant | Bahia | 315,301 | 41,002,444 |
| Tégula Frederico plant Westphalen | Rio Grande do Sul | 434,218 | 5,002,786 |
| Tégula plant at São José do Rio Preto | São Paulo | 222,812 | 36,902,390 |
| Tégula Anápolis plant | Goiás | 658,564 | 85,272,001 |
| Minaçu | Goiás | 16,483,280 | 11,942,134 |
| Percentage tax levied by the municipality (%) | |
|---|---|
| Goiânia plant | 17.2 |
| Anápolis plant | 12.2 |
| Simões Filho plant | 86.4 |
| Rio de Janeiro plant | 12.5 |
| Colombo plant | 41.4 |
| Tégula Atibaia plant | 15.7 |
| Tégula Içara plant | 9.9 |
| Tégula Camaçari plant | 0.8 |
| Tégula Frederico plant Westphalen | 8.7 |
| Tégula plant at São José do Rio Preto | 0.6 |
| Tégula Anápolis plant | 0.8 |
| Minaçu | 138.0 |
Indirect economic impacts
During the year, the Group’s economic influence thus contributed, to the sustainable development of the communities close to its operations, and the economy of each region where its plants are located, through the levying of ICMS tax.
EC9In counterparty to this, for the investments made in the plants of Eternit, Tégula and SAMA in 2012, the Company received tax incentives of R$16,668,172 compared to R$14,068,101 in 2011.
EC4| Significant financial assistance received from government – R$ | 2012 | 2011 |
|---|---|---|
| Eternit | 12,979,188 | 12,771,725 |
| Sama | 2,564,872 | None |
| Tégula | 1,124,112 |
1,296,376 |
| Total | 16,668,172 |
14,068,101 |